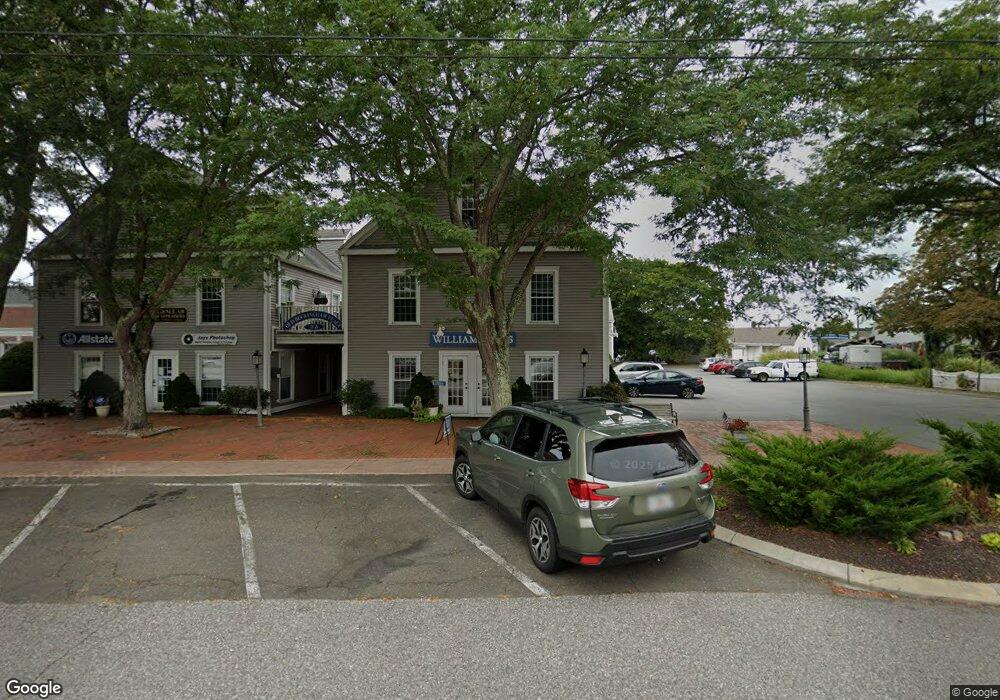
33 Main St Unit F Old Saybrook, CT 06475
Estimated Value: $156,262
--
Bed
--
Bath
1,140
Sq Ft
$137/Sq Ft
Est. Value
About This Home
This home is located at 33 Main St Unit F, Old Saybrook, CT 06475 and is currently estimated at $156,262, approximately $137 per square foot. 33 Main St Unit F is a home located in Middlesex County with nearby schools including Kathleen E. Goodwin School, Old Saybrook Middle School, and Old Saybrook Senior High School.
Ownership History
Date
Name
Owned For
Owner Type
Purchase Details
Closed on
Mar 5, 2019
Sold by
33 Main Llc
Bought by
Christopher Real Est Mgmt
Current Estimated Value
Home Financials for this Owner
Home Financials are based on the most recent Mortgage that was taken out on this home.
Original Mortgage
$60,000
Outstanding Balance
$52,750
Interest Rate
4.4%
Mortgage Type
Purchase Money Mortgage
Estimated Equity
$103,512
Purchase Details
Closed on
Oct 28, 2011
Sold by
Swerdloff Mark H and Gometz Ralph
Bought by
33 Main Llc
Purchase Details
Closed on
Mar 4, 1993
Sold by
Essex Sb
Bought by
Swerdloff Mark H
Home Financials for this Owner
Home Financials are based on the most recent Mortgage that was taken out on this home.
Original Mortgage
$44,000
Interest Rate
7.96%
Mortgage Type
Commercial
Purchase Details
Closed on
Oct 24, 1991
Sold by
Mann John and Clein Bonnie M
Bought by
Essex Svg Bk
Create a Home Valuation Report for This Property
The Home Valuation Report is an in-depth analysis detailing your home's value as well as a comparison with similar homes in the area
Home Values in the Area
Average Home Value in this Area
Purchase History
| Date | Buyer | Sale Price | Title Company |
|---|---|---|---|
| Christopher Real Est Mgmt | $80,000 | -- | |
| 33 Main Llc | $63,000 | -- | |
| Swerdloff Mark H | $55,000 | -- | |
| Essex Svg Bk | $57,000 | -- |
Source: Public Records
Mortgage History
| Date | Status | Borrower | Loan Amount |
|---|---|---|---|
| Open | Christopher Real Est Mgmt | $60,000 | |
| Previous Owner | Essex Svg Bk | $44,000 | |
| Previous Owner | Essex Svg Bk | $44,000 |
Source: Public Records
Tax History Compared to Growth
Tax History
| Year | Tax Paid | Tax Assessment Tax Assessment Total Assessment is a certain percentage of the fair market value that is determined by local assessors to be the total taxable value of land and additions on the property. | Land | Improvement |
|---|---|---|---|---|
| 2025 | $978 | $63,100 | $0 | $63,100 |
| 2024 | $959 | $63,100 | $0 | $63,100 |
| 2023 | $1,147 | $56,100 | $0 | $56,100 |
| 2022 | $1,126 | $56,100 | $0 | $56,100 |
| 2021 | $1,125 | $56,100 | $0 | $56,100 |
| 2020 | $1,055 | $52,600 | $0 | $52,600 |
| 2019 | $1,039 | $52,600 | $0 | $52,600 |
| 2018 | $1,013 | $51,700 | $0 | $51,700 |
| 2017 | $1,016 | $51,700 | $0 | $51,700 |
| 2016 | $996 | $51,700 | $0 | $51,700 |
| 2015 | $972 | $51,700 | $0 | $51,700 |
| 2014 | $956 | $51,700 | $0 | $51,700 |
Source: Public Records
Map
Nearby Homes
- 125 Main St
- 81 Coulter St Unit 4
- 100 Dudley Ave Unit H43
- 24 Cottage Place
- 66 Pennywise Ln
- 18 Cottage Place
- 20 Saltus Dr
- 18 Quarry St
- 355 Main St
- 60 Ingham Hill Rd
- 21 Farview Ave
- 6 South St
- 20 Hill St
- 16 Howard St
- 48 Great Hammock Rd
- 0 Merritt Ln
- 46 Maple Ave
- 396 Middlesex Turnpike
- 7 Sharon Ln
- 2 Old South Cove Rd
- 33 Main St Unit L
- 33 Main St
- 33 Main St Unit A & B
- 63 Main St
- 21 Main St
- 19 Main St
- 658 Boston Post Rd
- 670 Boston Post Rd
- 50 Main St
- 688 Boston Post Rd
- 11 Coulter St Unit 17
- 11 Coulter St Unit 26
- 11 Coulter St Unit 9
- 11 Coulter St Unit 12
- 11 Coulter St Unit 20
- 11 Coulter St
- 11 Coulter St Unit 21
- 11 Coulter St Unit 25
- 11 Coulter St Unit 24
- 11 Coulter St Unit 2