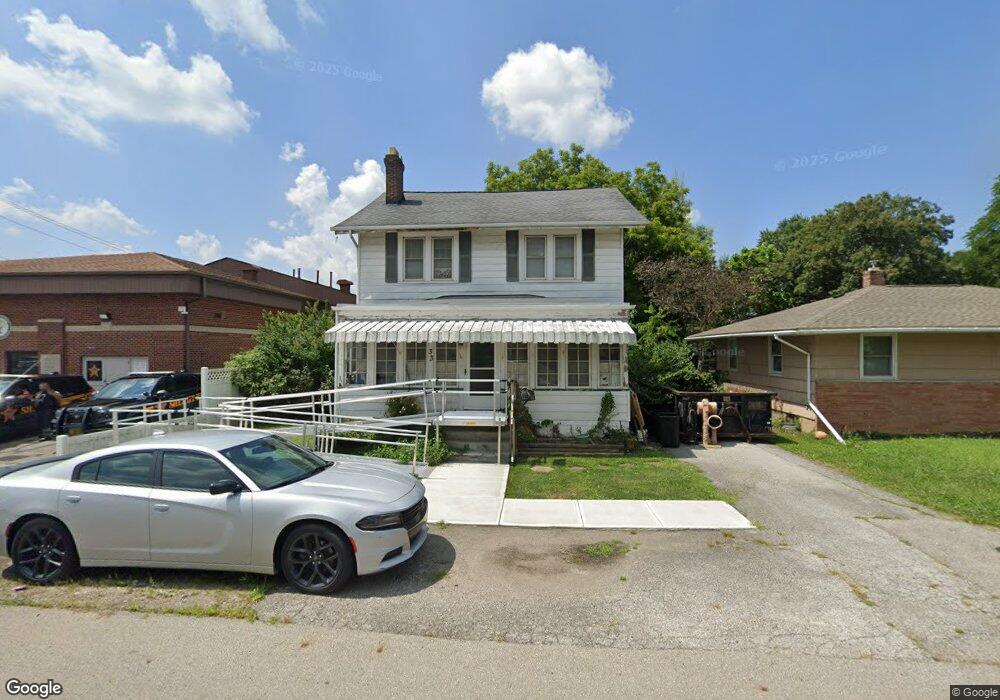
33 Maple Dr Columbus, OH 43228
Estimated Value: $238,000 - $281,000
3
Beds
2
Baths
1,620
Sq Ft
$154/Sq Ft
Est. Value
About This Home
This home is located at 33 Maple Dr, Columbus, OH 43228 and is currently estimated at $250,187, approximately $154 per square foot. 33 Maple Dr is a home located in Franklin County with nearby schools including Galloway Ridge Intermediate School, Prairie Lincoln Elementary School, and Norton Middle School.
Ownership History
Date
Name
Owned For
Owner Type
Purchase Details
Closed on
Nov 18, 1999
Sold by
Cooper James R and Cooper Erin S
Bought by
Serafini Sean and Serafini Sean A
Current Estimated Value
Home Financials for this Owner
Home Financials are based on the most recent Mortgage that was taken out on this home.
Original Mortgage
$85,942
Outstanding Balance
$24,949
Interest Rate
8.02%
Estimated Equity
$225,238
Purchase Details
Closed on
Apr 18, 1997
Sold by
Renu Realty Inc
Bought by
Cooper James R and Cooper Erin S
Home Financials for this Owner
Home Financials are based on the most recent Mortgage that was taken out on this home.
Original Mortgage
$76,250
Interest Rate
7.92%
Mortgage Type
FHA
Purchase Details
Closed on
Jul 23, 1996
Sold by
Pr Kenneth Breckenridge
Bought by
Timothy R Farkas
Create a Home Valuation Report for This Property
The Home Valuation Report is an in-depth analysis detailing your home's value as well as a comparison with similar homes in the area
Home Values in the Area
Average Home Value in this Area
Purchase History
| Date | Buyer | Sale Price | Title Company |
|---|---|---|---|
| Serafini Sean | $85,900 | -- | |
| Cooper James R | $78,000 | Preferred Title Agency Inc | |
| Renu Realty Inc | $39,500 | Preferred Title Agency Inc | |
| Timothy R Farkas | $34,100 | -- |
Source: Public Records
Mortgage History
| Date | Status | Borrower | Loan Amount |
|---|---|---|---|
| Open | Serafini Sean | $85,942 | |
| Previous Owner | Cooper James R | $76,250 |
Source: Public Records
Tax History
| Year | Tax Paid | Tax Assessment Tax Assessment Total Assessment is a certain percentage of the fair market value that is determined by local assessors to be the total taxable value of land and additions on the property. | Land | Improvement |
|---|---|---|---|---|
| 2025 | $3,289 | $72,700 | $15,680 | $57,020 |
| 2024 | $3,289 | $72,700 | $15,680 | $57,020 |
| 2023 | $3,146 | $72,695 | $15,680 | $57,015 |
| 2022 | $2,406 | $38,960 | $3,920 | $35,040 |
| 2021 | $2,444 | $38,960 | $3,920 | $35,040 |
| 2020 | $2,928 | $38,960 | $3,920 | $35,040 |
| 2019 | $2,934 | $33,250 | $3,290 | $29,960 |
| 2018 | $2,085 | $33,250 | $3,290 | $29,960 |
| 2017 | $2,030 | $33,250 | $3,290 | $29,960 |
| 2016 | $1,819 | $24,580 | $5,010 | $19,570 |
| 2015 | $1,819 | $24,580 | $5,010 | $19,570 |
| 2014 | $1,797 | $24,580 | $5,010 | $19,570 |
| 2013 | $1,068 | $28,910 | $5,880 | $23,030 |
Source: Public Records
Map
Nearby Homes
- 69 Lawrence Ave
- 154 Maple Dr
- 5409 Longworth Dr
- 110 Inah Ave
- 185 Sturbridge Rd
- 89 Postle Blvd
- 381 Pasadena Ave
- 396 Pasadena Ave
- 443 Lawrence Ave
- 352 Postle Blvd
- 102 Redmond Rd
- 354 Fernhill Ave
- 5713 Larksdale Dr
- 87 Tarryton Ct W Unit 18D
- 97 Tarryton Ct W Unit 19-H
- 400 Evergreen Terrace
- 376 Galloway Ridge Dr
- 5843 Tully Cross Dr
- 129 Beacon Run W Unit 21C
- 4723 Tarryton Ct S Unit 14-E
Your Personal Tour Guide
Ask me questions while you tour the home.