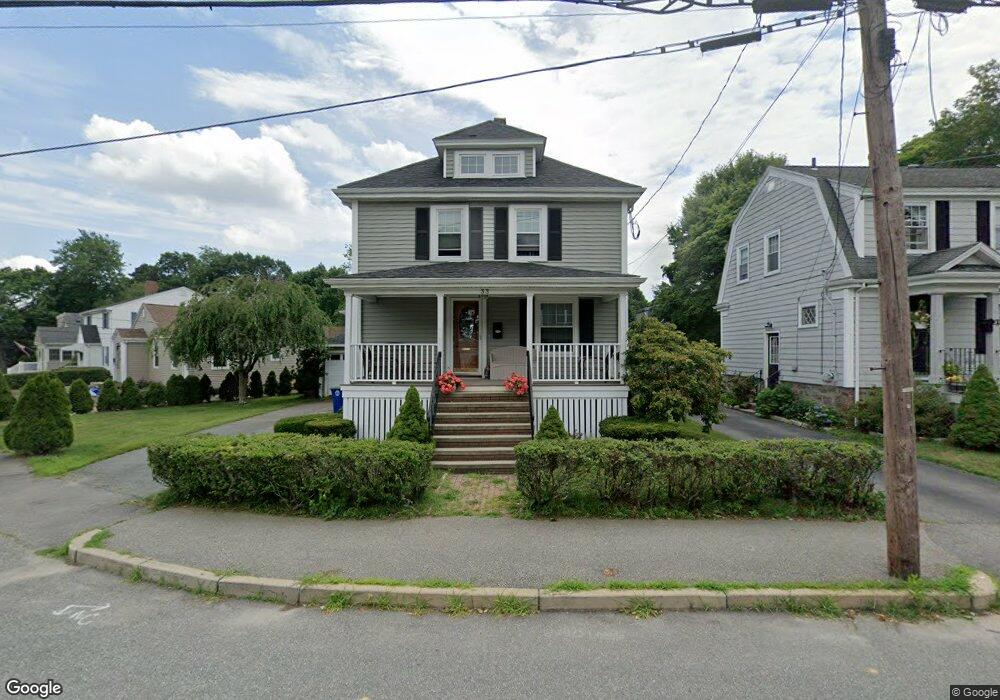
33 Marshall St Braintree, MA 02184
East Braintree NeighborhoodEstimated Value: $717,000 - $859,000
4
Beds
3
Baths
1,952
Sq Ft
$405/Sq Ft
Est. Value
About This Home
This home is located at 33 Marshall St, Braintree, MA 02184 and is currently estimated at $790,637, approximately $405 per square foot. 33 Marshall St is a home located in Norfolk County with nearby schools including Braintree High School, Step Ahead Kindergarten, and Sacred Heart Elementary School.
Ownership History
Date
Name
Owned For
Owner Type
Purchase Details
Closed on
Aug 12, 1988
Sold by
Johnson James R
Bought by
Maggio Louis C
Current Estimated Value
Home Financials for this Owner
Home Financials are based on the most recent Mortgage that was taken out on this home.
Original Mortgage
$126,000
Interest Rate
10.34%
Mortgage Type
Purchase Money Mortgage
Create a Home Valuation Report for This Property
The Home Valuation Report is an in-depth analysis detailing your home's value as well as a comparison with similar homes in the area
Home Values in the Area
Average Home Value in this Area
Purchase History
| Date | Buyer | Sale Price | Title Company |
|---|---|---|---|
| Maggio Louis C | $140,000 | -- |
Source: Public Records
Mortgage History
| Date | Status | Borrower | Loan Amount |
|---|---|---|---|
| Closed | Maggio Louis C | $128,000 | |
| Closed | Maggio Louis C | $126,000 |
Source: Public Records
Tax History
| Year | Tax Paid | Tax Assessment Tax Assessment Total Assessment is a certain percentage of the fair market value that is determined by local assessors to be the total taxable value of land and additions on the property. | Land | Improvement |
|---|---|---|---|---|
| 2025 | $6,813 | $682,700 | $345,900 | $336,800 |
| 2024 | $6,208 | $654,900 | $324,300 | $330,600 |
| 2023 | $5,841 | $598,500 | $285,400 | $313,100 |
| 2022 | $5,697 | $572,600 | $259,500 | $313,100 |
| 2021 | $5,118 | $514,400 | $218,800 | $295,600 |
| 2020 | $4,951 | $502,100 | $218,800 | $283,300 |
| 2019 | $4,869 | $482,600 | $218,800 | $263,800 |
| 2018 | $4,676 | $443,600 | $190,300 | $253,300 |
| 2017 | $4,428 | $412,300 | $173,000 | $239,300 |
| 2016 | $4,232 | $385,400 | $155,700 | $229,700 |
| 2015 | $4,140 | $374,000 | $152,200 | $221,800 |
| 2014 | $3,954 | $346,200 | $140,100 | $206,100 |
Source: Public Records
Map
Nearby Homes
- 36 Chestnut Ave
- 50 Cleveland Ave
- 14 Hillside Rd
- 255 River St
- 599 Union St
- 300 Commercial St Unit 23
- 20 Vine St
- 31 Doris Rd
- 26 Tingley Rd
- 564 Middle St
- 342 Elm St
- 469-471 Washington St
- 491 Washington St Unit 1
- 41 Lantern Ln
- 37 Lantern Ln
- 5 Woodsum Dr Unit 12
- 140 Commercial St
- 17 White Rd
- 312 Shaw St
- 54 Edgemont Rd
- 7 Watson St
- 29 Marshall St
- 10 Penniman Terrace
- 9 Watson St
- 36 Marshall St
- 40 Marshall St
- 49 Marshall St
- 30 Marshall St
- 18 Penniman Terrace
- 21 Marshall St
- 44 Marshall St
- 11 Watson St
- 26 Marshall St
- 12 Watson St
- 46 Marshall St
- 9 Penniman Terrace
- 19 Marshall St
- 24 Marshall St
- 24 Penniman Terrace
- 15 Penniman Terrace
Your Personal Tour Guide
Ask me questions while you tour the home.