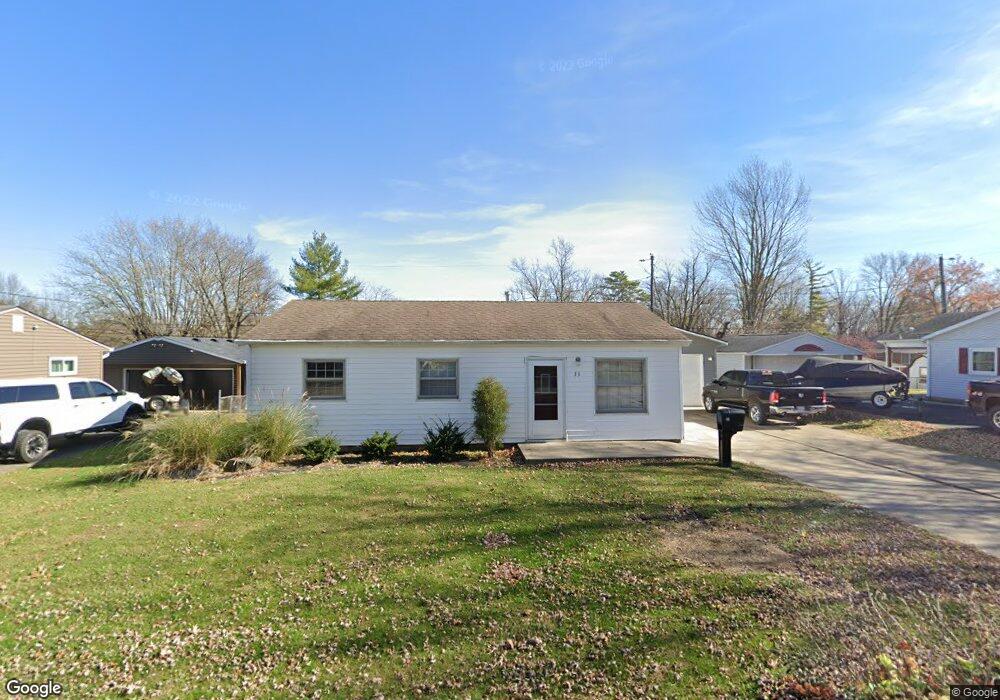
33 Martin Dr Danville, IN 46122
Estimated Value: $185,000 - $204,275
3
Beds
1
Bath
936
Sq Ft
$206/Sq Ft
Est. Value
About This Home
This home is located at 33 Martin Dr, Danville, IN 46122 and is currently estimated at $192,569, approximately $205 per square foot. 33 Martin Dr is a home located in Hendricks County with nearby schools including North Elementary School, South Elementary School, and Danville Middle School.
Ownership History
Date
Name
Owned For
Owner Type
Purchase Details
Closed on
Aug 7, 2020
Sold by
Jeremiah Holdings Llc
Bought by
Bolton Trevor M
Current Estimated Value
Home Financials for this Owner
Home Financials are based on the most recent Mortgage that was taken out on this home.
Original Mortgage
$134,343
Outstanding Balance
$119,172
Interest Rate
3%
Mortgage Type
New Conventional
Estimated Equity
$73,397
Purchase Details
Closed on
Dec 31, 2018
Sold by
Lane Duane R and Lane Patricia J
Bought by
Jeremiah Holdings Llc
Purchase Details
Closed on
Sep 19, 2013
Sold by
Hendricks County Sheriff
Bought by
Lane Duane R and Lane Patricia J
Purchase Details
Closed on
Mar 11, 2009
Sold by
Myers Terry D and Myers Richard P
Bought by
Roberson John W
Home Financials for this Owner
Home Financials are based on the most recent Mortgage that was taken out on this home.
Original Mortgage
$78,655
Interest Rate
5.2%
Mortgage Type
VA
Create a Home Valuation Report for This Property
The Home Valuation Report is an in-depth analysis detailing your home's value as well as a comparison with similar homes in the area
Home Values in the Area
Average Home Value in this Area
Purchase History
| Date | Buyer | Sale Price | Title Company |
|---|---|---|---|
| Bolton Trevor M | $133,000 | None Available | |
| Jeremiah Holdings Llc | -- | None Available | |
| Lane Duane R | -- | -- | |
| Roberson John W | -- | None Available |
Source: Public Records
Mortgage History
| Date | Status | Borrower | Loan Amount |
|---|---|---|---|
| Open | Bolton Trevor M | $134,343 | |
| Previous Owner | Roberson John W | $78,655 |
Source: Public Records
Tax History Compared to Growth
Tax History
| Year | Tax Paid | Tax Assessment Tax Assessment Total Assessment is a certain percentage of the fair market value that is determined by local assessors to be the total taxable value of land and additions on the property. | Land | Improvement |
|---|---|---|---|---|
| 2024 | $1,206 | $145,000 | $31,700 | $113,300 |
| 2023 | $881 | $119,600 | $28,800 | $90,800 |
| 2022 | $964 | $108,600 | $26,000 | $82,600 |
| 2021 | $839 | $103,500 | $27,400 | $76,100 |
| 2020 | $745 | $96,300 | $27,400 | $68,900 |
| 2019 | $1,216 | $60,800 | $26,500 | $34,300 |
| 2018 | $1,292 | $64,600 | $26,500 | $38,100 |
| 2017 | $1,254 | $62,700 | $25,200 | $37,500 |
| 2016 | $1,608 | $80,400 | $25,200 | $55,200 |
| 2014 | $1,272 | $63,600 | $22,900 | $40,700 |
Source: Public Records
Map
Nearby Homes
- 613 Barrett St
- 98 Bosstick Ave
- 963 W Clinton St
- 34 Round Hill Ct
- 840 S Kentucky St
- 1325 Brookwood Cir
- 236 Sam Himsel Way
- 1331 McCormicks Cir
- 277 Highland Ave
- 1348 McCormicks Cir
- 290 Highland Ave
- 108 Velvet Hat Rd
- 3969 Canning St
- 304 Highland Ave
- 331 Highland Ave
- 302 Northpointe Ct
- 159 Velvet Hat Rd
- 436 Orchard Blvd
- 168 Velvet Hat Rd
- 137 N Tennessee St