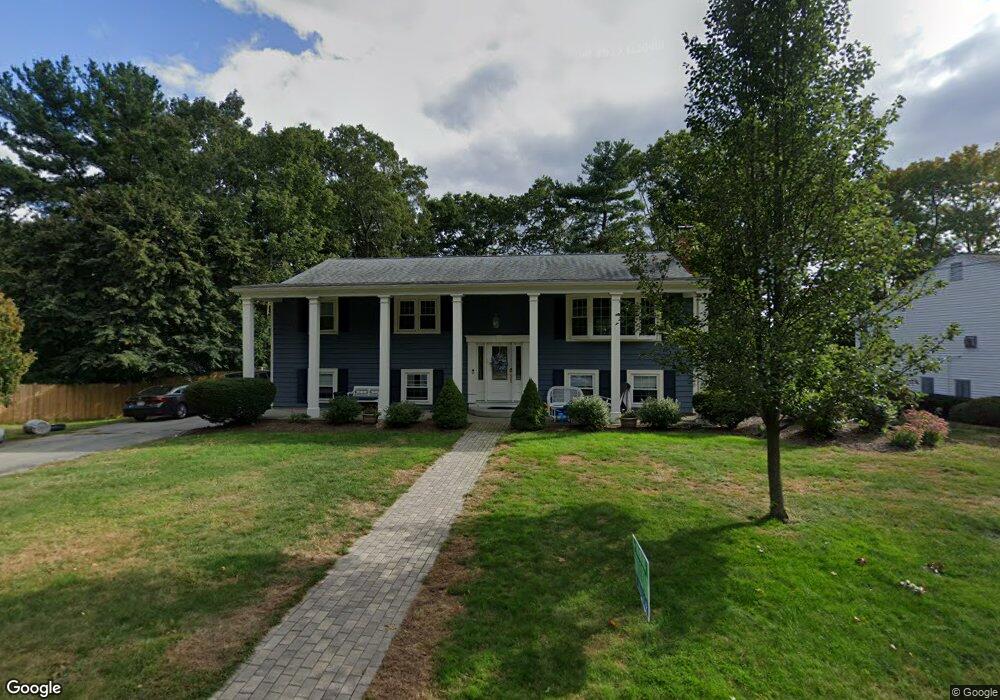
33 Mayotte Cir Brockton, MA 02301
Estimated Value: $640,000 - $740,000
3
Beds
3
Baths
2,500
Sq Ft
$269/Sq Ft
Est. Value
About This Home
This home is located at 33 Mayotte Cir, Brockton, MA 02301 and is currently estimated at $672,155, approximately $268 per square foot. 33 Mayotte Cir is a home located in Plymouth County with nearby schools including Hancock Elementary School, Manthala George Jr. School, and Louis F Angelo Elementary School.
Ownership History
Date
Name
Owned For
Owner Type
Purchase Details
Closed on
Jul 19, 1988
Sold by
Abrams Arthur M
Bought by
Christianson Ronald
Current Estimated Value
Home Financials for this Owner
Home Financials are based on the most recent Mortgage that was taken out on this home.
Original Mortgage
$120,000
Interest Rate
10.57%
Mortgage Type
Purchase Money Mortgage
Create a Home Valuation Report for This Property
The Home Valuation Report is an in-depth analysis detailing your home's value as well as a comparison with similar homes in the area
Home Values in the Area
Average Home Value in this Area
Purchase History
| Date | Buyer | Sale Price | Title Company |
|---|---|---|---|
| Christianson Ronald | $183,000 | -- |
Source: Public Records
Mortgage History
| Date | Status | Borrower | Loan Amount |
|---|---|---|---|
| Open | Christianson Ronald | $70,000 | |
| Closed | Christianson Ronald | $25,100 | |
| Closed | Christianson Ronald | $115,700 | |
| Closed | Christianson Ronald | $120,000 |
Source: Public Records
Tax History Compared to Growth
Tax History
| Year | Tax Paid | Tax Assessment Tax Assessment Total Assessment is a certain percentage of the fair market value that is determined by local assessors to be the total taxable value of land and additions on the property. | Land | Improvement |
|---|---|---|---|---|
| 2025 | $7,250 | $598,700 | $154,300 | $444,400 |
| 2024 | $6,925 | $576,100 | $154,300 | $421,800 |
| 2023 | $6,687 | $515,200 | $119,900 | $395,300 |
| 2022 | $6,404 | $458,400 | $109,300 | $349,100 |
| 2021 | $6,323 | $436,100 | $100,900 | $335,200 |
| 2020 | $5,992 | $395,500 | $96,600 | $298,900 |
| 2019 | $5,776 | $371,700 | $90,300 | $281,400 |
| 2018 | $5,652 | $351,900 | $90,300 | $261,600 |
| 2017 | $5,313 | $330,000 | $90,300 | $239,700 |
| 2016 | $5,376 | $309,700 | $86,600 | $223,100 |
| 2015 | $5,559 | $306,300 | $86,600 | $219,700 |
| 2014 | $5,051 | $278,600 | $86,600 | $192,000 |
Source: Public Records
Map
Nearby Homes