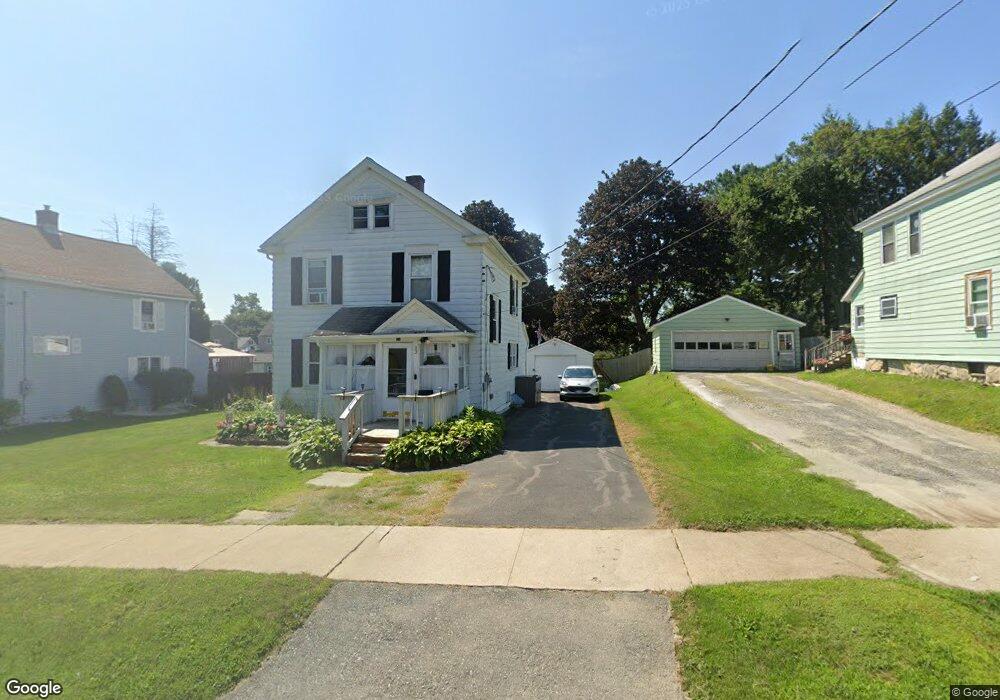
33 Mcarthur St Pittsfield, MA 01201
Estimated Value: $223,474 - $259,000
3
Beds
1
Bath
1,376
Sq Ft
$170/Sq Ft
Est. Value
About This Home
This home is located at 33 Mcarthur St, Pittsfield, MA 01201 and is currently estimated at $233,619, approximately $169 per square foot. 33 Mcarthur St is a home located in Berkshire County with nearby schools including Silvio O. Conte Community School, John T. Reid Middle School, and Taconic High School.
Ownership History
Date
Name
Owned For
Owner Type
Purchase Details
Closed on
Aug 31, 2007
Sold by
Newton Henry A and Gwinnell Fred A
Bought by
Daly Stephen T
Current Estimated Value
Purchase Details
Closed on
Sep 23, 1991
Sold by
Mcleod Harry E and Mcleod Laurie J
Bought by
Rathbun Paul J and Rathbun Kellie M
Home Financials for this Owner
Home Financials are based on the most recent Mortgage that was taken out on this home.
Original Mortgage
$81,201
Interest Rate
9.17%
Mortgage Type
Purchase Money Mortgage
Create a Home Valuation Report for This Property
The Home Valuation Report is an in-depth analysis detailing your home's value as well as a comparison with similar homes in the area
Home Values in the Area
Average Home Value in this Area
Purchase History
| Date | Buyer | Sale Price | Title Company |
|---|---|---|---|
| Daly Stephen T | $72,000 | -- | |
| Daly Stephen T | $72,000 | -- | |
| Daly Stephen T | $72,000 | -- | |
| Rathbun Paul J | $82,000 | -- | |
| Rathbun Paul J | $82,000 | -- |
Source: Public Records
Mortgage History
| Date | Status | Borrower | Loan Amount |
|---|---|---|---|
| Previous Owner | Rathbun Paul J | $26,529 | |
| Previous Owner | Rathbun Paul J | $80,185 | |
| Previous Owner | Rathbun Paul J | $81,201 |
Source: Public Records
Tax History Compared to Growth
Tax History
| Year | Tax Paid | Tax Assessment Tax Assessment Total Assessment is a certain percentage of the fair market value that is determined by local assessors to be the total taxable value of land and additions on the property. | Land | Improvement |
|---|---|---|---|---|
| 2025 | $3,405 | $189,800 | $56,600 | $133,200 |
| 2024 | $3,151 | $170,800 | $56,600 | $114,200 |
| 2023 | $2,851 | $155,600 | $51,200 | $104,400 |
| 2022 | $2,556 | $137,700 | $47,300 | $90,400 |
| 2021 | $2,495 | $129,600 | $47,300 | $82,300 |
| 2020 | $2,501 | $126,900 | $47,300 | $79,600 |
| 2019 | $2,412 | $124,200 | $47,300 | $76,900 |
| 2018 | $2,431 | $121,500 | $47,300 | $74,200 |
| 2017 | $2,371 | $120,800 | $49,200 | $71,600 |
| 2016 | $2,240 | $119,400 | $49,200 | $70,200 |
| 2015 | $2,156 | $119,400 | $49,200 | $70,200 |
Source: Public Records
Map
Nearby Homes