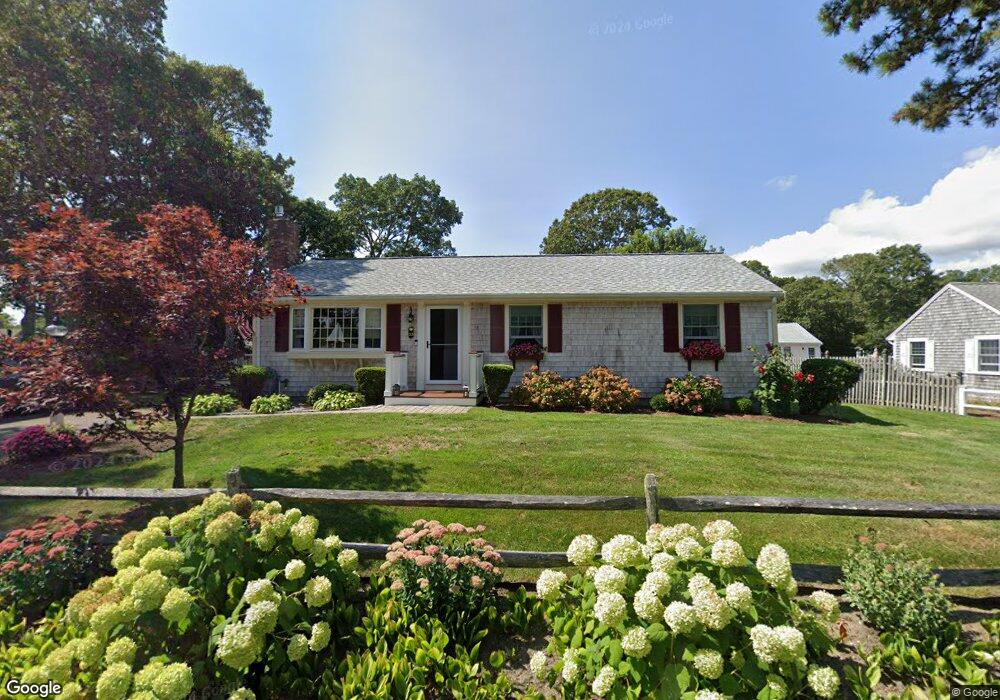
33 Michaels Ave Dennis Port, MA 02639
Dennis Port NeighborhoodEstimated Value: $623,000 - $734,000
3
Beds
1
Bath
1,001
Sq Ft
$695/Sq Ft
Est. Value
About This Home
This home is located at 33 Michaels Ave, Dennis Port, MA 02639 and is currently estimated at $695,499, approximately $694 per square foot. 33 Michaels Ave is a home located in Barnstable County with nearby schools including Dennis-Yarmouth Regional High School and St. Pius X. School.
Ownership History
Date
Name
Owned For
Owner Type
Purchase Details
Closed on
Apr 30, 1998
Sold by
Polk Carol A
Bought by
Szymansky Gerald R and Szymansky Dorothy L
Current Estimated Value
Home Financials for this Owner
Home Financials are based on the most recent Mortgage that was taken out on this home.
Original Mortgage
$80,000
Outstanding Balance
$15,550
Interest Rate
7.04%
Mortgage Type
Purchase Money Mortgage
Estimated Equity
$679,949
Create a Home Valuation Report for This Property
The Home Valuation Report is an in-depth analysis detailing your home's value as well as a comparison with similar homes in the area
Home Values in the Area
Average Home Value in this Area
Purchase History
| Date | Buyer | Sale Price | Title Company |
|---|---|---|---|
| Szymansky Gerald R | $124,250 | -- |
Source: Public Records
Mortgage History
| Date | Status | Borrower | Loan Amount |
|---|---|---|---|
| Open | Szymansky Gerald R | $50,000 | |
| Open | Szymansky Gerald R | $80,000 |
Source: Public Records
Tax History Compared to Growth
Tax History
| Year | Tax Paid | Tax Assessment Tax Assessment Total Assessment is a certain percentage of the fair market value that is determined by local assessors to be the total taxable value of land and additions on the property. | Land | Improvement |
|---|---|---|---|---|
| 2025 | $2,920 | $674,400 | $214,400 | $460,000 |
| 2024 | $2,784 | $634,200 | $206,200 | $428,000 |
| 2023 | $2,693 | $576,600 | $187,400 | $389,200 |
| 2022 | $2,641 | $471,600 | $168,800 | $302,800 |
| 2021 | $2,665 | $442,000 | $189,200 | $252,800 |
| 2020 | $2,409 | $394,900 | $165,500 | $229,400 |
| 2019 | $2,277 | $369,100 | $162,300 | $206,800 |
| 2018 | $2,185 | $344,600 | $154,500 | $190,100 |
| 2017 | $2,014 | $327,500 | $143,400 | $184,100 |
| 2016 | $2,034 | $311,500 | $154,500 | $157,000 |
| 2015 | $1,994 | $311,500 | $154,500 | $157,000 |
| 2014 | $1,838 | $289,400 | $132,400 | $157,000 |
Source: Public Records
Map
Nearby Homes
- 80 Michaels Ave
- 19 Standish Way
- 12 Spoonbill Rd
- 71 Main St
- 4 Coffey Ln
- 31 Easy St
- 125 Main St Unit 3
- 22 Wixon Rd
- 15 Woodside Park Rd
- 72 Bassett Ln
- 37 Ocean Dr Unit 2
- 61 Trotters Ln
- 268 Main St
- 26 Center St
- 95 Center St
- 64 Beaten Rd
- 112 Old Wharf Rd Unit E4
- 112 Old Wharf Rd Unit E1
- 3 Pinefield Ln
- 154 Old Wharf Rd Unit 26