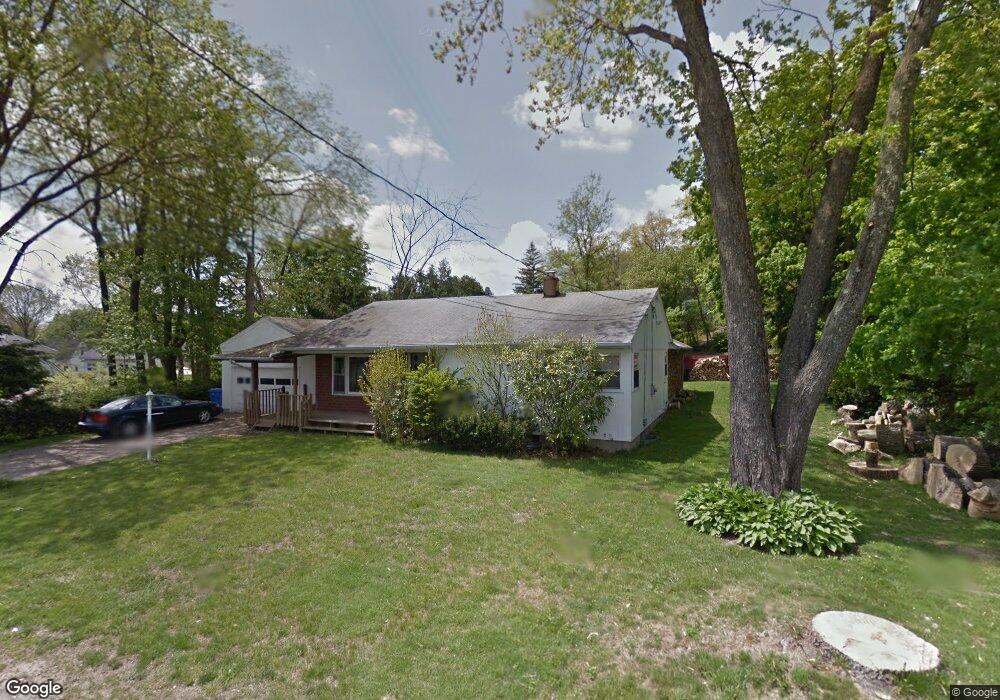
33 Morton Rd Waterbury, CT 06705
East End District NeighborhoodEstimated Value: $288,000 - $354,000
2
Beds
1
Bath
1,810
Sq Ft
$175/Sq Ft
Est. Value
About This Home
This home is located at 33 Morton Rd, Waterbury, CT 06705 and is currently estimated at $316,698, approximately $174 per square foot. 33 Morton Rd is a home located in New Haven County with nearby schools including H.S. Chase School, Michael F. Wallace Middle School, and Crosby High School.
Ownership History
Date
Name
Owned For
Owner Type
Purchase Details
Closed on
Jul 19, 2012
Sold by
Svedrovic Alex
Bought by
Svedrovic John
Current Estimated Value
Home Financials for this Owner
Home Financials are based on the most recent Mortgage that was taken out on this home.
Original Mortgage
$101,250
Outstanding Balance
$69,740
Interest Rate
3.7%
Estimated Equity
$246,958
Purchase Details
Closed on
Jun 24, 2005
Sold by
Small Deborah
Bought by
Svedrovic Alex
Home Financials for this Owner
Home Financials are based on the most recent Mortgage that was taken out on this home.
Original Mortgage
$134,883
Interest Rate
5.82%
Mortgage Type
Purchase Money Mortgage
Purchase Details
Closed on
Mar 25, 1997
Sold by
Calvo Vincent
Bought by
Berluti Tonya
Home Financials for this Owner
Home Financials are based on the most recent Mortgage that was taken out on this home.
Original Mortgage
$81,900
Interest Rate
7.68%
Mortgage Type
Purchase Money Mortgage
Purchase Details
Closed on
Mar 10, 1995
Sold by
Citicorp Mtg
Bought by
Calvo Vincent and Woodward Rebecca
Purchase Details
Closed on
Jan 9, 1990
Sold by
Simko David R
Bought by
Nadeau Gelman
Create a Home Valuation Report for This Property
The Home Valuation Report is an in-depth analysis detailing your home's value as well as a comparison with similar homes in the area
Home Values in the Area
Average Home Value in this Area
Purchase History
| Date | Buyer | Sale Price | Title Company |
|---|---|---|---|
| Svedrovic John | -- | -- | |
| Svedrovic Alex | $137,000 | -- | |
| Berluti Tonya | $82,000 | -- | |
| Calvo Vincent | $70,500 | -- | |
| Nadeau Gelman | $136,000 | -- |
Source: Public Records
Mortgage History
| Date | Status | Borrower | Loan Amount |
|---|---|---|---|
| Open | Nadeau Gelman | $101,250 | |
| Closed | Nadeau Gelman | $13,486 | |
| Previous Owner | Nadeau Gelman | $134,883 | |
| Previous Owner | Nadeau Gelman | $81,900 |
Source: Public Records
Tax History Compared to Growth
Tax History
| Year | Tax Paid | Tax Assessment Tax Assessment Total Assessment is a certain percentage of the fair market value that is determined by local assessors to be the total taxable value of land and additions on the property. | Land | Improvement |
|---|---|---|---|---|
| 2025 | $6,612 | $147,000 | $20,650 | $126,350 |
| 2024 | $7,268 | $147,000 | $20,650 | $126,350 |
| 2023 | $7,966 | $147,000 | $20,650 | $126,350 |
| 2022 | $5,060 | $84,040 | $20,660 | $63,380 |
| 2021 | $5,060 | $84,040 | $20,660 | $63,380 |
| 2020 | $5,060 | $84,040 | $20,660 | $63,380 |
| 2019 | $5,060 | $84,040 | $20,660 | $63,380 |
| 2018 | $5,060 | $84,040 | $20,660 | $63,380 |
| 2017 | $5,535 | $91,930 | $20,660 | $71,270 |
| 2016 | $5,535 | $91,930 | $20,660 | $71,270 |
| 2015 | $5,335 | $91,630 | $20,360 | $71,270 |
| 2014 | $5,335 | $91,630 | $20,360 | $71,270 |
Source: Public Records
Map
Nearby Homes
- 108 Alexander Ave
- 975 Meriden Rd Unit 55
- 975 Meriden Rd Unit 20
- 162 Townsend Ave
- 29 Courtland Ave
- 312 Celia Dr
- 23 Heaton St
- 188 Beth Ln
- 1190 Meriden Rd
- 49 Birchfield Dr
- 17 Capitol Ave
- 283 Courtland Ave
- 81 Capitol Ave
- 135 Norris St
- 226 Beth Ln
- 161 Birchfield Dr
- 286 Beth Ln Unit 16
- 152 Woodbine St
- 312 Capitol Ave
- 57 Cedar Ave