33 Mountain Rd Concord, NH 03301
East Concord NeighborhoodEstimated Value: $521,000 - $606,953
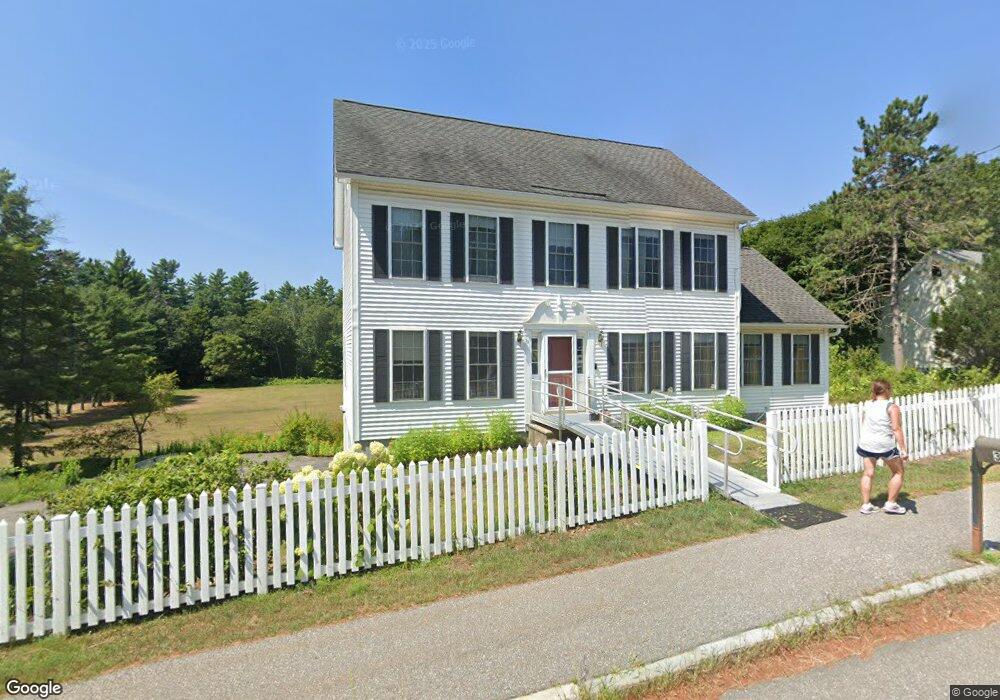
About This Home
This home is located at 33 Mountain Rd, Concord, NH 03301 and is currently estimated at $577,988, approximately $274 per square foot. 33 Mountain Rd is a home located in Merrimack County with nearby schools including Broken Ground School, Rundlett Middle School, and Concord High School.
Ownership History
We collect this data history from publicly available records. To have your information removed, we recommend requesting removal directly through your county’s website.
Purchase Details
Home Values in the Area
Average Home Value in this Area
Purchase History
We collect this data history from publicly available records. To have your information removed, we recommend requesting removal directly through your county’s website.
| Date | Buyer | Sale Price | Title Company |
|---|---|---|---|
| $310,000 | -- | ||
| $310,000 | -- |
Mortgage History
We collect this data history from publicly available records. To have your information removed, we recommend requesting removal directly through your county’s website.
| Date | Status | Borrower | Loan Amount |
|---|---|---|---|
| Open | $175,000 | ||
| Closed | $192,200 | ||
| Closed | $36,000 |
Tax History
We collect this data history from publicly available records. To have your information removed, we recommend requesting removal directly through your county’s website.
| Year | Tax Paid | Tax Assessment Tax Assessment Total Assessment is a certain percentage of the fair market value that is determined by local assessors to be the total taxable value of land and additions on the property. | Land | Improvement |
|---|---|---|---|---|
| 2025 | $10,698 | $367,500 | $143,400 | $224,100 |
| 2024 | $10,176 | $367,500 | $143,400 | $224,100 |
| 2023 | $9,876 | $367,700 | $143,400 | $224,300 |
| 2022 | $9,520 | $367,700 | $143,400 | $224,300 |
| 2021 | $9,237 | $367,700 | $143,400 | $224,300 |
| 2020 | $8,617 | $322,000 | $88,500 | $233,500 |
| 2019 | $8,640 | $311,000 | $89,200 | $221,800 |
| 2018 | $8,372 | $297,000 | $89,200 | $207,800 |
| 2017 | $8,051 | $285,100 | $85,900 | $199,200 |
| 2016 | $7,781 | $281,200 | $85,900 | $195,300 |
| 2015 | $7,442 | $263,800 | $85,900 | $177,900 |
| 2014 | $7,072 | $263,800 | $85,900 | $177,900 |
| 2013 | -- | $263,800 | $85,900 | $177,900 |
| 2012 | -- | $259,600 | $81,700 | $177,900 |
Map
- 61 Mountain Rd
- 35 Shaker Rd
- 9 Styles Dr
- 69 Shawmut St
- 59 Oak Hill Rd
- 14 Jennifer Dr
- 34 Callaway Dr Unit 4
- 24 Foxcross Cir
- 5 Callaway Dr Unit 5
- 4 K St
- 72 Oakmont Dr
- 179-181 N State St
- 456 N State St Unit 458
- 4 Otter Dr
- 2 Glendale Rd
- 9 Checkerberry Ln
- 39 Penacook St
- 5 Piscataqua Rd
- 19 Grappone Dr
- 102 N State St
Ask me questions while you tour the home.