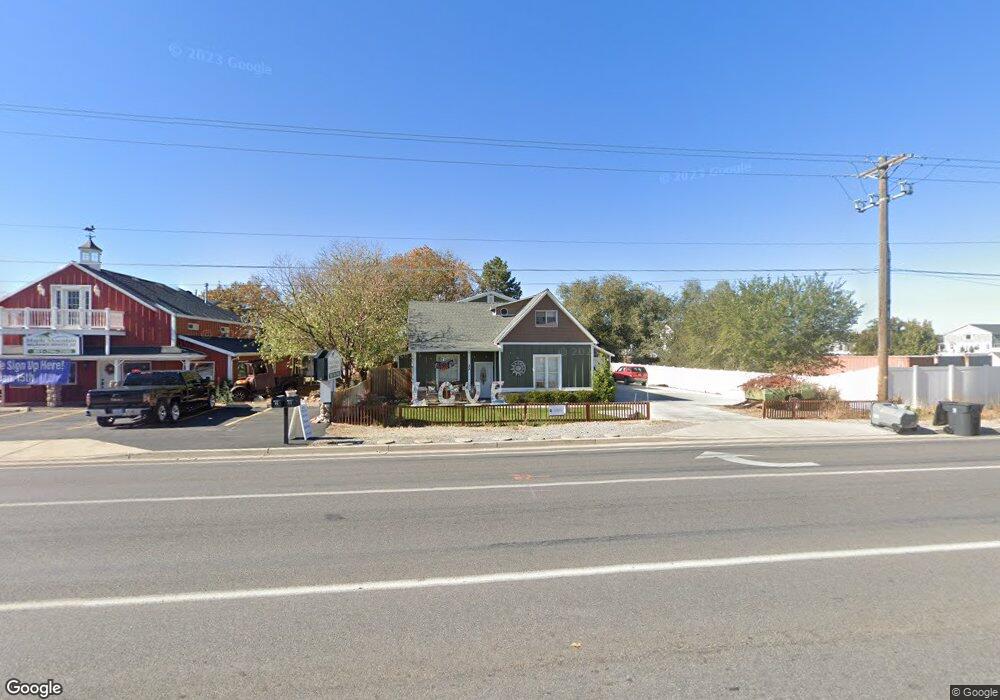
33 N 1600 W Mapleton, UT 84664
Estimated Value: $640,000 - $760,000
7
Beds
3
Baths
3,192
Sq Ft
$216/Sq Ft
Est. Value
About This Home
This home is located at 33 N 1600 W, Mapleton, UT 84664 and is currently estimated at $690,106, approximately $216 per square foot. 33 N 1600 W is a home located in Utah County with nearby schools including Maple Ridge Elementary, Mapleton Junior High School, and Maple Mountain High School.
Ownership History
Date
Name
Owned For
Owner Type
Purchase Details
Closed on
Oct 11, 2019
Sold by
Millet Jeremy
Bought by
Millet Haley and Millet Jeremy
Current Estimated Value
Home Financials for this Owner
Home Financials are based on the most recent Mortgage that was taken out on this home.
Original Mortgage
$292,800
Outstanding Balance
$195,203
Interest Rate
3.5%
Mortgage Type
New Conventional
Estimated Equity
$494,903
Purchase Details
Closed on
Jun 21, 2019
Sold by
Child Micalanne
Bought by
Millet Jeremy
Purchase Details
Closed on
Oct 17, 2017
Sold by
Mills Larry
Bought by
Child Micalanne
Purchase Details
Closed on
May 24, 2016
Sold by
Bainou Henri E and Stanley Jarmsey Revocable Trus
Bought by
Mills Larry
Purchase Details
Closed on
Feb 11, 2015
Sold by
Armsey Stanley
Bought by
Armsey Stanley J and The Stanley J Armsey Revocable
Purchase Details
Closed on
May 28, 2013
Sold by
Mills Larry
Bought by
Armsey Stanley
Create a Home Valuation Report for This Property
The Home Valuation Report is an in-depth analysis detailing your home's value as well as a comparison with similar homes in the area
Home Values in the Area
Average Home Value in this Area
Purchase History
| Date | Buyer | Sale Price | Title Company |
|---|---|---|---|
| Millet Haley | -- | Pro Title And Escrow Inc | |
| Millet Jeremy | -- | Highland Title | |
| Child Micalanne | -- | Vanguard Title Ins Agency | |
| Mills Larry | -- | Provo Land Title Co | |
| Armsey Stanley J | -- | None Available | |
| Armsey Stanley | -- | Empire Land Title Inc |
Source: Public Records
Mortgage History
| Date | Status | Borrower | Loan Amount |
|---|---|---|---|
| Open | Millet Haley | $292,800 |
Source: Public Records
Tax History
| Year | Tax Paid | Tax Assessment Tax Assessment Total Assessment is a certain percentage of the fair market value that is determined by local assessors to be the total taxable value of land and additions on the property. | Land | Improvement |
|---|---|---|---|---|
| 2025 | $2,863 | $320,705 | -- | -- |
| 2024 | $2,874 | $280,500 | $0 | $0 |
| 2023 | $2,786 | $283,305 | $0 | $0 |
| 2022 | $2,786 | $271,535 | $0 | $0 |
| 2021 | $2,325 | $347,900 | $138,100 | $209,800 |
| 2020 | $2,293 | $332,000 | $122,200 | $209,800 |
| 2019 | $2,053 | $303,300 | $118,000 | $185,300 |
| 2018 | $2,008 | $282,500 | $97,200 | $185,300 |
| 2017 | $1,673 | $124,905 | $0 | $0 |
| 2016 | $1,479 | $109,780 | $0 | $0 |
| 2015 | $1,316 | $97,075 | $0 | $0 |
| 2014 | $1,234 | $89,375 | $0 | $0 |
Source: Public Records
Map
Nearby Homes
- 1780 W Maple St
- 2652 W Maple St Unit 281
- 1655 W 200 S Unit A
- 1656 W 300 S Unit B
- 216 N 1750 W
- 1810 W 300 S Unit D
- 203 N 1900 W
- 1222 W 190 N
- 1272 W 220 N
- 262 N Santa fe Dr
- 1142 W 220 N
- 715 W 4600 S Unit Lot I303
- 715 W 4600 S Unit Lot I304
- 281 N Pheasant Dr
- 293 N Pheasant Dr
- 415 S 1200 W
- 1631 W Century Ln Unit B
- 1512 W 600 N Unit 4
- 1446 W 600 N Unit 5
- 581 N Heritage St Unit 5
- 15 N 1600 W
- 1650 W Maple St
- 91 N 1600 W
- 1690 W Maple St
- 10 S 1600 W
- 50 S 1600 W
- 56 N 1750 W
- 1655 W Maple St
- 1720 W Maple St
- 94 N 1750 W
- 94 N 1750 W Unit 2
- 94 N 1750 W Unit 1
- 64 S 1600 W
- 1685 W Maple St
- 1779 W Helen Way Unit 1
- 1779 W Helen Way
- 1778 W Helen Way Unit 11
- 103 S 1600 W
- 1676 W 200 N Unit LOT 8
- 1688 W 200 N Unit LOT 7
Your Personal Tour Guide
Ask me questions while you tour the home.