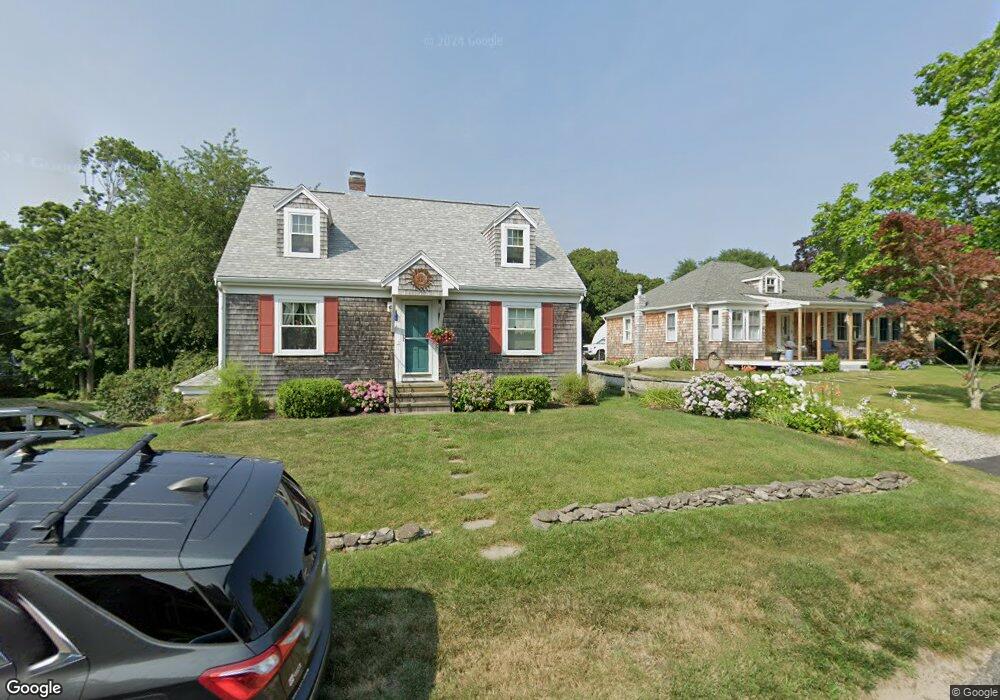
33 N Beach Ave Bourne, MA 02532
Monument Beach NeighborhoodEstimated Value: $507,000 - $692,000
2
Beds
2
Baths
1,248
Sq Ft
$465/Sq Ft
Est. Value
About This Home
This home is located at 33 N Beach Ave, Bourne, MA 02532 and is currently estimated at $580,087, approximately $464 per square foot. 33 N Beach Ave is a home located in Barnstable County with nearby schools including Bourne High School, St Margaret Regional School, and Cadence Academy Preschool - Bourne.
Ownership History
Date
Name
Owned For
Owner Type
Purchase Details
Closed on
Sep 23, 2022
Sold by
Gill Harold P
Bought by
Gill Harold P and Sammet Tommi A
Current Estimated Value
Purchase Details
Closed on
Mar 29, 2022
Sold by
Gill Barbara R
Bought by
Gill Barbara R and Gill Harold P
Purchase Details
Closed on
Dec 3, 1999
Sold by
Watson Mildred M and Watson Francis S
Bought by
Gill Barbara R
Home Financials for this Owner
Home Financials are based on the most recent Mortgage that was taken out on this home.
Original Mortgage
$107,900
Interest Rate
7.86%
Mortgage Type
Purchase Money Mortgage
Create a Home Valuation Report for This Property
The Home Valuation Report is an in-depth analysis detailing your home's value as well as a comparison with similar homes in the area
Home Values in the Area
Average Home Value in this Area
Purchase History
| Date | Buyer | Sale Price | Title Company |
|---|---|---|---|
| Gill Harold P | -- | None Available | |
| Gill Harold P | -- | None Available | |
| Gill Barbara R | -- | None Available | |
| Gill Barbara R | -- | None Available | |
| Gill Barbara R | $134,900 | -- | |
| Gill Barbara R | $134,900 | -- |
Source: Public Records
Mortgage History
| Date | Status | Borrower | Loan Amount |
|---|---|---|---|
| Previous Owner | Gill Barbara R | $107,900 |
Source: Public Records
Tax History
| Year | Tax Paid | Tax Assessment Tax Assessment Total Assessment is a certain percentage of the fair market value that is determined by local assessors to be the total taxable value of land and additions on the property. | Land | Improvement |
|---|---|---|---|---|
| 2025 | $3,343 | $428,100 | $193,900 | $234,200 |
| 2024 | $3,269 | $407,600 | $184,600 | $223,000 |
| 2023 | $3,179 | $360,800 | $163,400 | $197,400 |
| 2022 | $3,039 | $301,200 | $144,600 | $156,600 |
| 2021 | $2,953 | $274,200 | $131,600 | $142,600 |
| 2020 | $2,791 | $259,900 | $130,300 | $129,600 |
| 2019 | $2,536 | $241,300 | $119,000 | $122,300 |
| 2018 | $2,423 | $229,900 | $113,400 | $116,500 |
| 2017 | $2,329 | $226,100 | $112,300 | $113,800 |
| 2016 | $2,273 | $223,700 | $112,300 | $111,400 |
| 2015 | $2,253 | $223,700 | $112,300 | $111,400 |
Source: Public Records
Map
Nearby Homes
- 566 Shore Rd
- 203 County Rd
- 16 Amberwood Ct
- 35 Benedict Rd
- 13 Laurel Hill Ct
- 12 Turnberry Rd Unit 12
- 5 Harbor Hill Dr
- 4 Harbor Hill Dr
- 2 Applewood Ct
- 20 Colony Ave
- 5 Sea Knoll Ct
- 5 Zoli Ln
- 4 Hollyhock Knoll Ct Unit 4
- 4 Hollyhock Knoll Ct Unit 4
- 14 Navajo Rd
- 709 County Rd
- 60 Bourne Neck Dr
- 44 Cotuit Rd
- 254 Barlows Landing Rd
- 3 1st St
Your Personal Tour Guide
Ask me questions while you tour the home.