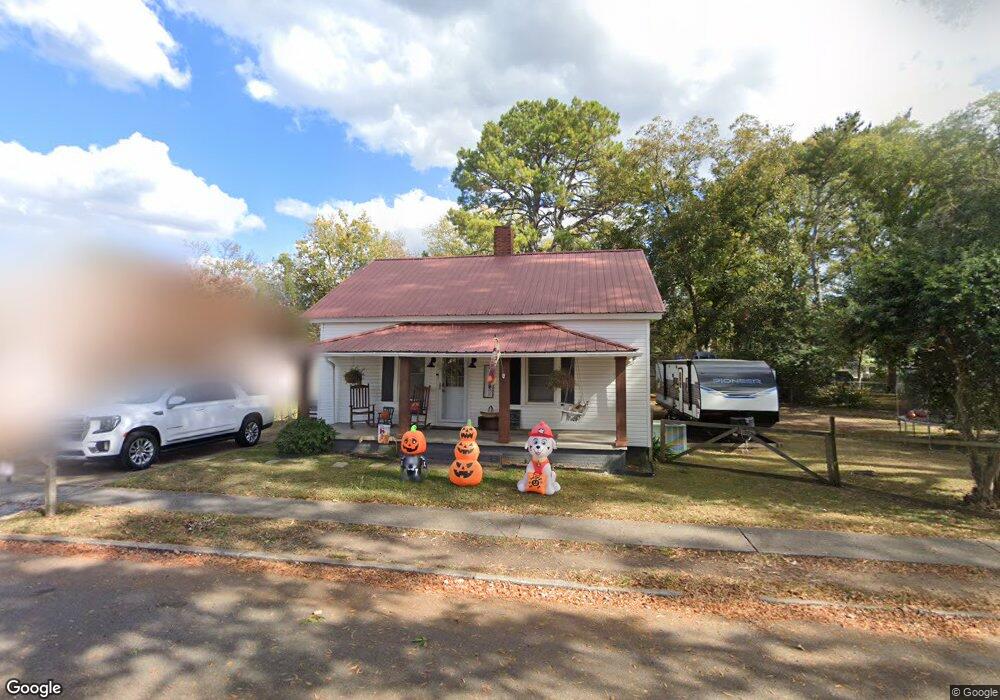
33 N Elm St Aragon, GA 30104
Estimated Value: $167,000 - $198,000
2
Beds
1
Bath
1,499
Sq Ft
$122/Sq Ft
Est. Value
About This Home
This home is located at 33 N Elm St, Aragon, GA 30104 and is currently estimated at $182,371, approximately $121 per square foot. 33 N Elm St is a home located in Polk County with nearby schools including Rockmart Middle School.
Ownership History
Date
Name
Owned For
Owner Type
Purchase Details
Closed on
Feb 5, 2024
Sold by
Childers Dennis E
Bought by
Streetman Ashley Childers
Current Estimated Value
Purchase Details
Closed on
Nov 8, 2019
Sold by
Childers Dennis E
Bought by
Childers Dennis E and Childers Bobby
Purchase Details
Closed on
Nov 16, 2015
Sold by
Hopper Beverly
Bought by
Childers Dennis E
Purchase Details
Closed on
Nov 5, 2009
Sold by
Childers Bobby E
Bought by
Hopper Beverly
Purchase Details
Closed on
Aug 4, 2003
Sold by
Childers Bobby E
Bought by
Childers Bobby E and Childe Barbara R
Purchase Details
Closed on
Sep 15, 1953
Bought by
Childers Bobby E
Create a Home Valuation Report for This Property
The Home Valuation Report is an in-depth analysis detailing your home's value as well as a comparison with similar homes in the area
Home Values in the Area
Average Home Value in this Area
Purchase History
| Date | Buyer | Sale Price | Title Company |
|---|---|---|---|
| Streetman Ashley Childers | -- | -- | |
| Streetman Ashley Childers | -- | -- | |
| Childers Dennis E | -- | -- | |
| Childers Dennis E | -- | -- | |
| Hopper Beverly | -- | -- | |
| Childers Bobby E | -- | -- | |
| Childers Bobby E | -- | -- |
Source: Public Records
Tax History Compared to Growth
Tax History
| Year | Tax Paid | Tax Assessment Tax Assessment Total Assessment is a certain percentage of the fair market value that is determined by local assessors to be the total taxable value of land and additions on the property. | Land | Improvement |
|---|---|---|---|---|
| 2024 | $1,913 | $66,712 | $8,000 | $58,712 |
| 2023 | $1,066 | $32,615 | $2,000 | $30,615 |
| 2022 | $664 | $27,978 | $2,000 | $25,978 |
| 2021 | $673 | $27,978 | $2,000 | $25,978 |
| 2020 | $674 | $27,978 | $2,000 | $25,978 |
| 2019 | $578 | $21,523 | $3,221 | $18,302 |
| 2018 | $577 | $20,931 | $3,221 | $17,710 |
| 2017 | $570 | $20,931 | $3,221 | $17,710 |
| 2016 | $570 | $20,931 | $3,221 | $17,710 |
| 2015 | $155 | $18,053 | $3,221 | $14,832 |
| 2014 | $149 | $17,405 | $2,573 | $14,832 |
Source: Public Records
Map
Nearby Homes
- 18 Elm St
- 58 Elm St
- 66 Elm St
- 1 E 4th St
- 19 Walnut St
- 0 Rome Hwy 101 Unit 25352772
- 0 Rome Hwy 101 Unit 10445422
- 11 Magnolia St
- 54 Taylorsville Rd
- 19 Williams St
- 11 Jenna Dr
- 100 Hixville Rd
- 65 Long Station Rd
- 135 Oak Hollow Way
- 156 Dogwood Glen Dr
- 180 Flint Hill Rd
- 133 N Bellview Rd
- 330 Flint Hill Rd
- 71 Caseys Ridge Rd
- 163 Portland Cir