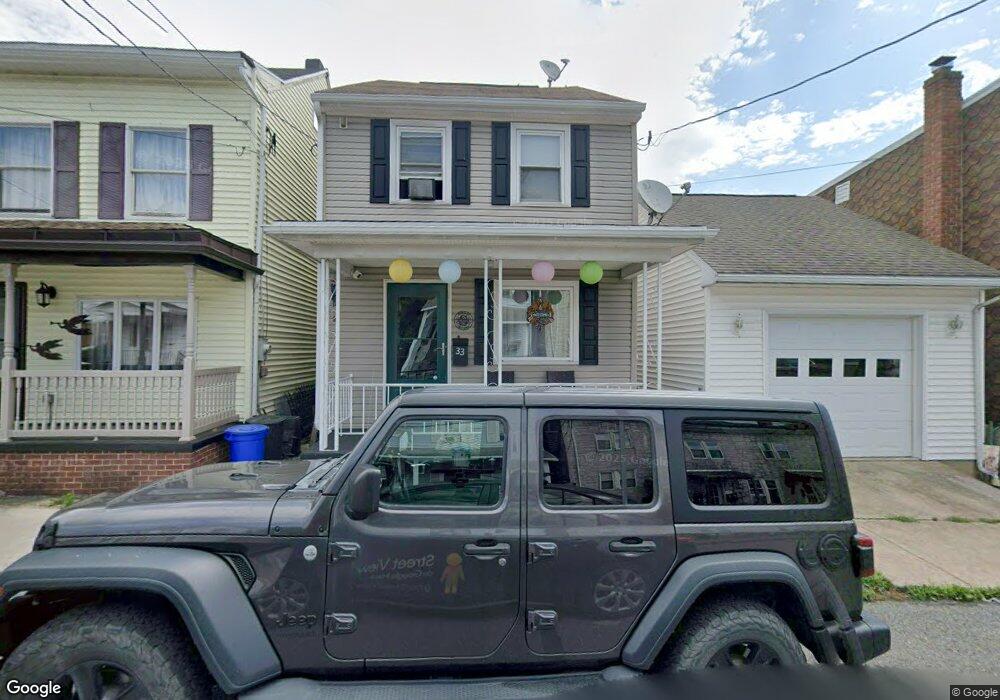
33 N Mill St Saint Clair, PA 17970
Estimated Value: $67,745 - $93,000
3
Beds
3
Baths
1,152
Sq Ft
$74/Sq Ft
Est. Value
About This Home
This home is located at 33 N Mill St, Saint Clair, PA 17970 and is currently estimated at $84,686, approximately $73 per square foot. 33 N Mill St is a home located in Schuylkill County with nearby schools including Saint Clair Area Elementary/Middle School, Gillingham Charter School, and ASSUMPTION BVM SCHOOL.
Ownership History
Date
Name
Owned For
Owner Type
Purchase Details
Closed on
May 3, 2016
Sold by
Well Rodney Sno and Well Heather Sno
Bought by
Ulicny Kimberly J
Current Estimated Value
Home Financials for this Owner
Home Financials are based on the most recent Mortgage that was taken out on this home.
Original Mortgage
$76,500
Outstanding Balance
$60,339
Interest Rate
3.71%
Mortgage Type
New Conventional
Estimated Equity
$24,347
Purchase Details
Closed on
Jun 9, 2010
Sold by
Hostetter Barbara A and Hertzog Catherine Ann
Bought by
Snowell Rodney
Home Financials for this Owner
Home Financials are based on the most recent Mortgage that was taken out on this home.
Original Mortgage
$86,298
Interest Rate
5.25%
Mortgage Type
FHA
Purchase Details
Closed on
Mar 12, 2008
Sold by
Meyer Paul and Meyer Barbara
Bought by
Meyer Barbara
Purchase Details
Closed on
Dec 22, 2005
Sold by
Covach William
Bought by
Meyer Paul and Meyer Barbara
Create a Home Valuation Report for This Property
The Home Valuation Report is an in-depth analysis detailing your home's value as well as a comparison with similar homes in the area
Home Values in the Area
Average Home Value in this Area
Purchase History
| Date | Buyer | Sale Price | Title Company |
|---|---|---|---|
| Ulicny Kimberly J | $85,000 | None Available | |
| Snowell Rodney | $87,500 | None Available | |
| Meyer Barbara | -- | None Available | |
| Meyer Paul | $68,500 | None Available |
Source: Public Records
Mortgage History
| Date | Status | Borrower | Loan Amount |
|---|---|---|---|
| Open | Ulicny Kimberly J | $76,500 | |
| Previous Owner | Snowell Rodney | $86,298 |
Source: Public Records
Tax History
| Year | Tax Paid | Tax Assessment Tax Assessment Total Assessment is a certain percentage of the fair market value that is determined by local assessors to be the total taxable value of land and additions on the property. | Land | Improvement |
|---|---|---|---|---|
| 2025 | $593 | $9,020 | $3,000 | $6,020 |
| 2024 | $555 | $9,020 | $3,000 | $6,020 |
| 2023 | $528 | $9,020 | $3,000 | $6,020 |
| 2022 | $528 | $9,020 | $3,000 | $6,020 |
| 2021 | $533 | $9,020 | $3,000 | $6,020 |
| 2020 | $533 | $9,020 | $3,000 | $6,020 |
| 2018 | $522 | $9,020 | $3,000 | $6,020 |
| 2017 | $502 | $9,020 | $3,000 | $6,020 |
| 2015 | -- | $9,020 | $3,000 | $6,020 |
| 2011 | -- | $9,020 | $0 | $0 |
Source: Public Records
Map
Nearby Homes
- 32 S Front St
- 141 S Nicholas St
- Lot 30 Elmwood Ct
- 0 - Lot 10 Elmwood Ct Unit 10
- 219 S 3rd St
- 0, 305, 307 S 2nd St
- 320 S Mill St
- 331 S 2nd St
- 1 S Front St Thwing St
- 108 Cherry St
- 117 Chestnut St
- 0 Caroline Ave Unit PASK2022658
- 714 Port Carbon Saint Clair Hwy
- 702 & 698 Port Carbon St Clair Hwy
- 11 Bryn Mawr Ave
- 15 Marcello Dr
- 717 5th St
- 758 Walnut St
- 0 Schuylkill Manor Rd Unit PASK2018142
- 935 N Centre St
Your Personal Tour Guide
Ask me questions while you tour the home.