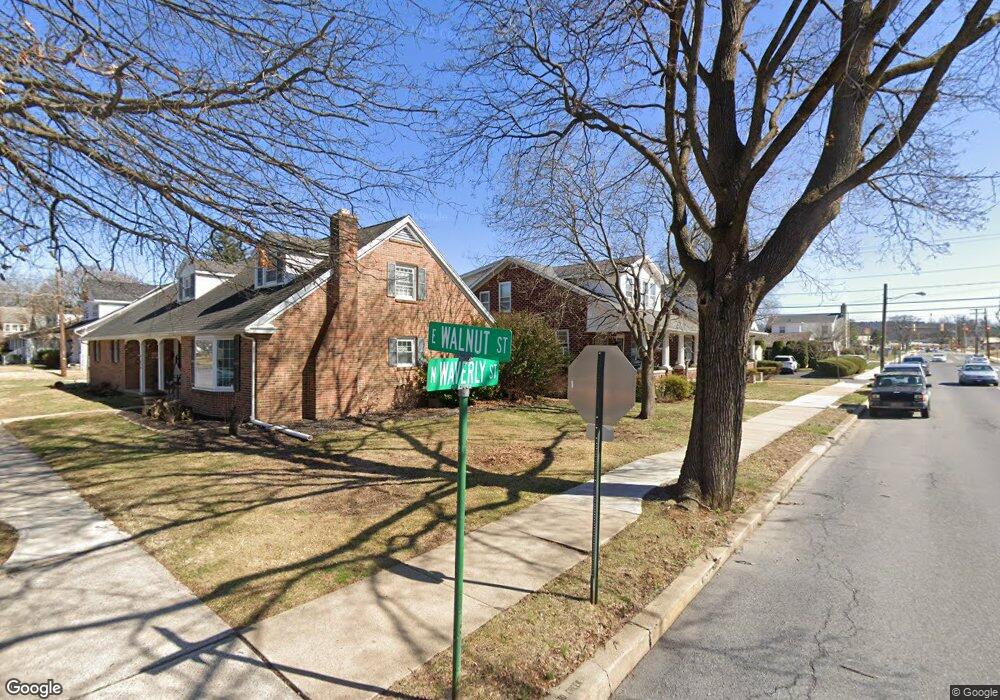
33 N Waverly St Reading, PA 19607
Estimated Value: $278,516 - $326,000
3
Beds
1
Bath
1,728
Sq Ft
$175/Sq Ft
Est. Value
About This Home
This home is located at 33 N Waverly St, Reading, PA 19607 and is currently estimated at $302,129, approximately $174 per square foot. 33 N Waverly St is a home located in Berks County with nearby schools including Cumru Elementary School, Governor Mifflin Intermediate School, and Governor Mifflin Middle School.
Ownership History
Date
Name
Owned For
Owner Type
Purchase Details
Closed on
Sep 18, 2017
Sold by
Knabb Paul David and Knabb Eileen Cheryl
Bought by
Knabb Eileen C
Current Estimated Value
Purchase Details
Closed on
Aug 13, 2015
Sold by
Knabb Paul David
Bought by
Knabb Paul David and Knabb Eileen Cheryl
Purchase Details
Closed on
Jan 30, 1996
Bought by
Knabb Paul David
Create a Home Valuation Report for This Property
The Home Valuation Report is an in-depth analysis detailing your home's value as well as a comparison with similar homes in the area
Home Values in the Area
Average Home Value in this Area
Purchase History
| Date | Buyer | Sale Price | Title Company |
|---|---|---|---|
| Knabb Eileen C | -- | -- | |
| Knabb Paul David | -- | None Available | |
| Knabb Paul David | -- | -- |
Source: Public Records
Tax History
| Year | Tax Paid | Tax Assessment Tax Assessment Total Assessment is a certain percentage of the fair market value that is determined by local assessors to be the total taxable value of land and additions on the property. | Land | Improvement |
|---|---|---|---|---|
| 2025 | $1,460 | $90,400 | $32,300 | $58,100 |
| 2024 | $4,121 | $90,400 | $32,300 | $58,100 |
| 2023 | $4,013 | $90,400 | $32,300 | $58,100 |
| 2022 | $3,968 | $90,400 | $32,300 | $58,100 |
| 2021 | $3,923 | $90,400 | $32,300 | $58,100 |
| 2020 | $3,923 | $90,400 | $32,300 | $58,100 |
| 2019 | $3,878 | $90,400 | $32,300 | $58,100 |
| 2018 | $3,833 | $90,400 | $32,300 | $58,100 |
| 2017 | $3,762 | $90,400 | $32,300 | $58,100 |
| 2016 | $1,286 | $90,400 | $32,300 | $58,100 |
| 2015 | $1,286 | $90,400 | $32,300 | $58,100 |
| 2014 | $1,175 | $90,400 | $32,300 | $58,100 |
Source: Public Records
Map
Nearby Homes
- 131 E Elm St
- 405 State St
- 311 Lynoak Ave
- 24 Philadelphia Ave
- 511 Grill Ave
- 526 Harding Ave
- 1504 Old Mill Rd
- 1716 Liggett Ave
- 204 High Blvd
- 135 Chestnut St
- 200 W Lancaster Ave
- 31 S Sterley St Unit 401
- 202 Museum Rd
- 512 Mifflin Blvd
- 1432 Liggett Ave
- 1617 Meadowlark Rd
- 1519 Meadowlark Rd
- 1406 Farr Rd
- 0 Cedar Top Rd
- 1378 Kenhorst Blvd
- 31 N Waverly St
- 310 E Walnut St
- 330 E Walnut St
- 303 E Lancaster Ave
- 305 E Lancaster Ave
- 101 N Waverly St
- 332 E Walnut St
- 34 N Waverly St
- 30 N Waverly St
- 38 N Waverly St
- 311 E Lancaster Ave
- 105 N Waverly St
- 229 E Lancaster Ave
- 325 E Walnut St
- 336 E Walnut St
- 109 N Waverly St
- 100 N Waverly St
- 327 E Walnut St
- 225 E Lancaster Ave
- 102 N Waverly St
Your Personal Tour Guide
Ask me questions while you tour the home.