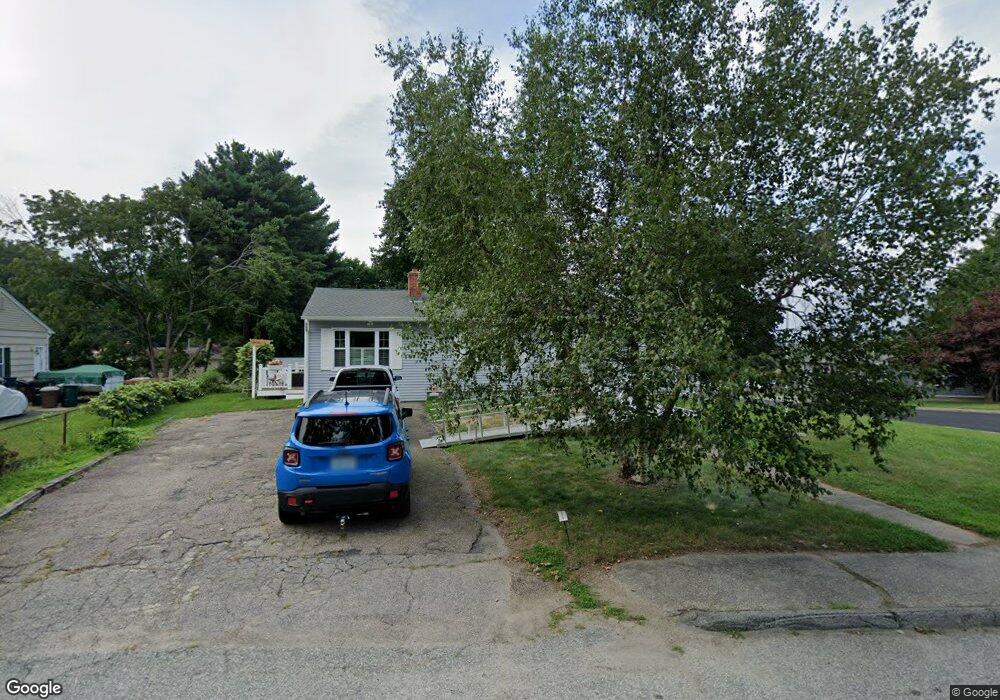
33 Noella Ave Coventry, RI 02816
Estimated Value: $430,931 - $513,000
4
Beds
2
Baths
1,945
Sq Ft
$234/Sq Ft
Est. Value
About This Home
This home is located at 33 Noella Ave, Coventry, RI 02816 and is currently estimated at $455,733, approximately $234 per square foot. 33 Noella Ave is a home located in Kent County with nearby schools including Alan Shawn Feinstein Ms Of Cov, Coventry High School, and Father John V. Doyle School.
Ownership History
Date
Name
Owned For
Owner Type
Purchase Details
Closed on
Apr 24, 2009
Sold by
Cinguegrana Charles M
Bought by
Albanese Peter A and Albanese Debra L
Current Estimated Value
Home Financials for this Owner
Home Financials are based on the most recent Mortgage that was taken out on this home.
Original Mortgage
$225,834
Interest Rate
4.93%
Mortgage Type
Purchase Money Mortgage
Purchase Details
Closed on
Aug 25, 2005
Sold by
Silva Dorothy A
Bought by
Cinquegrana Charles M
Purchase Details
Closed on
Aug 13, 1993
Sold by
Petschke Alan E and Petschke Janet
Bought by
Ferguson Dorothy A
Create a Home Valuation Report for This Property
The Home Valuation Report is an in-depth analysis detailing your home's value as well as a comparison with similar homes in the area
Purchase History
| Date | Buyer | Sale Price | Title Company |
|---|---|---|---|
| Albanese Peter A | $230,000 | -- | |
| Cinquegrana Charles M | $255,000 | -- | |
| Ferguson Dorothy A | $95,000 | -- |
Source: Public Records
Mortgage History
| Date | Status | Borrower | Loan Amount |
|---|---|---|---|
| Open | Ferguson Dorothy A | $240,000 | |
| Closed | Ferguson Dorothy A | $225,834 | |
| Closed | Ferguson Dorothy A | $8,050 |
Source: Public Records
Tax History
| Year | Tax Paid | Tax Assessment Tax Assessment Total Assessment is a certain percentage of the fair market value that is determined by local assessors to be the total taxable value of land and additions on the property. | Land | Improvement |
|---|---|---|---|---|
| 2025 | $5,298 | $329,300 | $103,000 | $226,300 |
| 2024 | $5,196 | $328,000 | $103,000 | $225,000 |
| 2023 | $5,028 | $328,000 | $103,000 | $225,000 |
| 2022 | $4,665 | $238,400 | $97,500 | $140,900 |
| 2021 | $4,625 | $238,400 | $97,500 | $140,900 |
| 2020 | $5,302 | $238,400 | $97,500 | $140,900 |
| 2019 | $4,450 | $200,100 | $78,800 | $121,300 |
| 2018 | $4,324 | $200,100 | $78,800 | $121,300 |
| 2017 | $4,198 | $200,100 | $78,800 | $121,300 |
| 2016 | $4,027 | $188,100 | $86,300 | $101,800 |
| 2015 | $3,918 | $188,100 | $86,300 | $101,800 |
| 2014 | $3,632 | $188,100 | $86,300 | $101,800 |
| 2013 | $3,650 | $195,600 | $84,300 | $111,300 |
Source: Public Records
Map
Nearby Homes
Your Personal Tour Guide
Ask me questions while you tour the home.