Estimated Value: $449,000 - $532,000
3
Beds
--
Bath
1,544
Sq Ft
$319/Sq Ft
Est. Value
About This Home
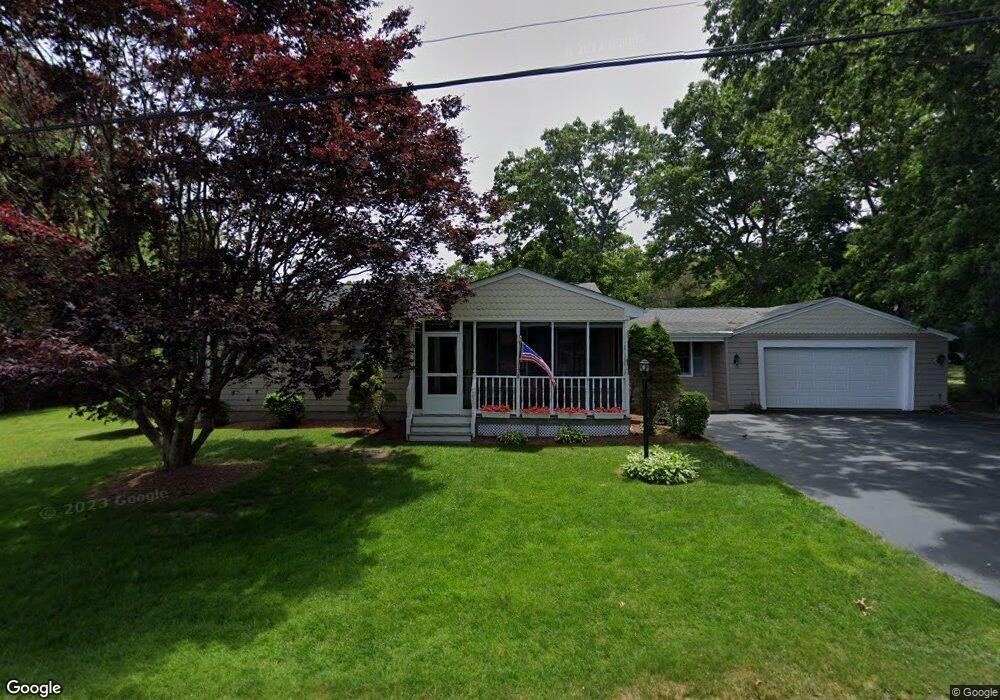
This home is located at 33 O Dr, Westport, MA 02790 and is currently estimated at $492,564, approximately $319 per square foot. 33 O Dr is a home located in Bristol County with nearby schools including Alice A. Macomber Primary School, Westport Elementary School, and Westport Middle-High School.
Ownership History
Date
Name
Owned For
Owner Type
Purchase Details
Closed on
Feb 24, 2017
Sold by
King Ft
Bought by
North Light Rt
Current Estimated Value
Purchase Details
Closed on
Jan 29, 2010
Sold by
Lundy James F and Lundy Rose M
Bought by
Lundy Michael J and Missick Christine
Purchase Details
Closed on
Aug 30, 2001
Sold by
33 O Dr Rt and Stlaurent Georgette P
Bought by
Lundy James F and Lundy Rose M
Create a Home Valuation Report for This Property
The Home Valuation Report is an in-depth analysis detailing your home's value as well as a comparison with similar homes in the area
Home Values in the Area
Average Home Value in this Area
Purchase History
| Date | Buyer | Sale Price | Title Company |
|---|---|---|---|
| North Light Rt | $225,000 | -- | |
| Lundy Michael J | -- | -- | |
| Lundy James F | $192,000 | -- |
Source: Public Records
Mortgage History
| Date | Status | Borrower | Loan Amount |
|---|---|---|---|
| Previous Owner | Lundy James F | $65,000 |
Source: Public Records
Tax History Compared to Growth
Tax History
| Year | Tax Paid | Tax Assessment Tax Assessment Total Assessment is a certain percentage of the fair market value that is determined by local assessors to be the total taxable value of land and additions on the property. | Land | Improvement |
|---|---|---|---|---|
| 2025 | $2,929 | $393,100 | $159,500 | $233,600 |
| 2024 | $2,923 | $378,200 | $147,800 | $230,400 |
| 2023 | $2,801 | $343,200 | $134,600 | $208,600 |
| 2022 | $2,489 | $299,900 | $122,400 | $177,500 |
| 2021 | $2,489 | $288,800 | $111,300 | $177,500 |
| 2020 | $2,397 | $284,300 | $106,800 | $177,500 |
| 2019 | $2,347 | $283,800 | $106,800 | $177,000 |
| 2018 | $2,135 | $261,300 | $108,000 | $153,300 |
| 2017 | $2,031 | $254,800 | $104,500 | $150,300 |
| 2016 | $1,879 | $237,500 | $101,100 | $136,400 |
| 2015 | $1,786 | $225,200 | $103,400 | $121,800 |
Source: Public Records
Map
Nearby Homes