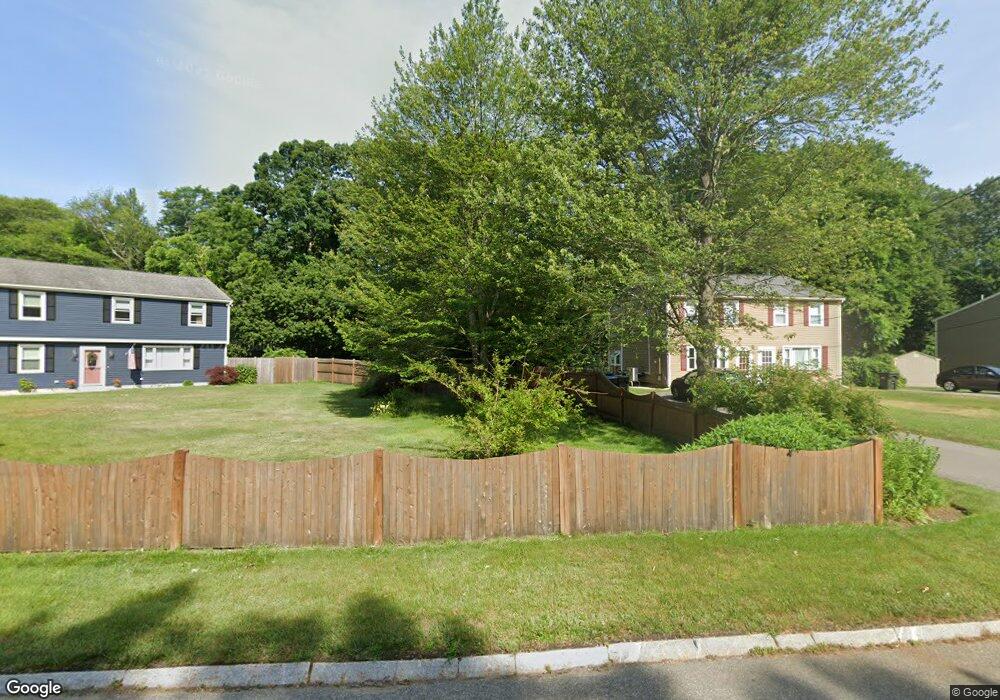
33 Old Forge Rd Bridgewater, MA 02324
Estimated Value: $328,000 - $416,000
2
Beds
2
Baths
1,080
Sq Ft
$334/Sq Ft
Est. Value
About This Home
This home is located at 33 Old Forge Rd, Bridgewater, MA 02324 and is currently estimated at $360,317, approximately $333 per square foot. 33 Old Forge Rd is a home located in Plymouth County with nearby schools including Mitchell Elementary School, Williams Intermediate School, and Bridgewater Middle School.
Ownership History
Date
Name
Owned For
Owner Type
Purchase Details
Closed on
Aug 10, 2022
Sold by
Wilber Russell and Wilber Dorothy
Bought by
Allen Lt
Current Estimated Value
Purchase Details
Closed on
Jun 30, 2005
Sold by
Fernandes Michael D
Bought by
Wilber Russell E and Wilber Dorothy
Home Financials for this Owner
Home Financials are based on the most recent Mortgage that was taken out on this home.
Original Mortgage
$199,200
Interest Rate
5.73%
Mortgage Type
Purchase Money Mortgage
Purchase Details
Closed on
Feb 27, 2004
Sold by
Fernandes Michael D and Anderson Shashanna L
Bought by
Fernandes Michael D
Purchase Details
Closed on
Dec 7, 2001
Sold by
Silvonic Mary J
Bought by
Fernandes Michael D and Anderson Shashanna L
Purchase Details
Closed on
Jul 31, 1997
Sold by
Nash Peter D and Nash Christine M
Bought by
Silvonic Mary J
Create a Home Valuation Report for This Property
The Home Valuation Report is an in-depth analysis detailing your home's value as well as a comparison with similar homes in the area
Home Values in the Area
Average Home Value in this Area
Purchase History
| Date | Buyer | Sale Price | Title Company |
|---|---|---|---|
| Allen Lt | $300,000 | None Available | |
| Wilber Russell E | $249,000 | -- | |
| Fernandes Michael D | -- | -- | |
| Fernandes Michael D | $151,000 | -- | |
| Silvonic Mary J | $81,000 | -- |
Source: Public Records
Mortgage History
| Date | Status | Borrower | Loan Amount |
|---|---|---|---|
| Previous Owner | Silvonic Mary J | $189,000 | |
| Previous Owner | Silvonic Mary J | $199,200 | |
| Previous Owner | Silvonic Mary J | $132,175 |
Source: Public Records
Tax History
| Year | Tax Paid | Tax Assessment Tax Assessment Total Assessment is a certain percentage of the fair market value that is determined by local assessors to be the total taxable value of land and additions on the property. | Land | Improvement |
|---|---|---|---|---|
| 2025 | $3,632 | $307,000 | $0 | $307,000 |
| 2024 | $3,519 | $289,900 | $0 | $289,900 |
| 2023 | $3,331 | $259,400 | $0 | $259,400 |
| 2022 | $3,239 | $226,200 | $0 | $226,200 |
| 2021 | $3,054 | $210,900 | $0 | $210,900 |
| 2020 | $2,865 | $194,500 | $0 | $194,500 |
| 2019 | $2,726 | $183,800 | $0 | $183,800 |
| 2018 | $2,639 | $173,700 | $0 | $173,700 |
| 2017 | $2,496 | $159,900 | $0 | $159,900 |
| 2016 | $2,413 | $155,300 | $0 | $155,300 |
| 2015 | $2,420 | $149,000 | $0 | $149,000 |
| 2014 | $2,423 | $149,100 | $0 | $149,100 |
Source: Public Records
Map
Nearby Homes
- 18 Aldrich Rd
- 5 Heather Ln
- 180 Main St Unit 6109
- 180 Main St Unit 4105
- 57 Stetson St
- 30 Oak Meadow Place Unit 30
- 48 Wall St
- 118 Plesant St
- 0 Bedford St Unit 73480500
- 47 Hale St
- 459 High St
- Lot 2 Fontana Way
- 30 Keenan St
- 167 Spring St
- 51 Cottage St
- 54 Michael Rd Unit 33
- 30 Sanger St
- 580 Broad St Unit 2
- 580 Broad St Unit 1
- 120 Worcester St
- 33 Old Forge Rd Unit 33
- 33 Old Forge Rd Unit 33,33
- 31 Old Forge Rd
- 25 Old Forge Rd
- 27 Old Forge Rd
- 35 Old Forge Rd
- 32 Old Forge Rd
- 30 Old Forge Rd
- 32 Old Forge Rd Unit 32
- 30 Old Forge Rd Unit 30
- 30 Old Forge Rd Unit 118A,30
- 56 Mary Ln Unit 8
- 56 Mary Ln Unit 7
- 56 Mary Ln Unit 5
- 56 Mary Ln Unit 4
- 56 Mary Ln Unit 3
- 56 Mary Ln Unit 2
- 56 Mary Ln Unit 1
- 56 Mary Ln Unit 2, 56
- 56 Mary Ln Unit 56 MARY 5
Your Personal Tour Guide
Ask me questions while you tour the home.