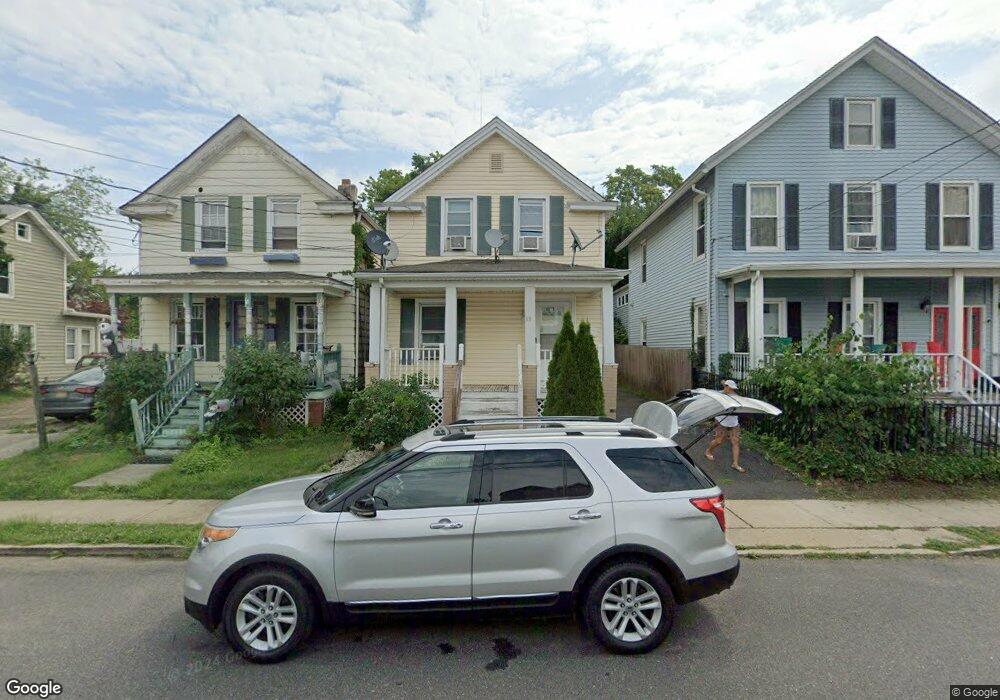
33 Osborn St Keyport, NJ 07735
Estimated Value: $472,000 - $500,000
--
Bed
2
Baths
1,500
Sq Ft
$321/Sq Ft
Est. Value
About This Home
This home is located at 33 Osborn St, Keyport, NJ 07735 and is currently estimated at $481,736, approximately $321 per square foot. 33 Osborn St is a home located in Monmouth County with nearby schools including Keyport Central School, Keyport High School, and Icob Academy.
Ownership History
Date
Name
Owned For
Owner Type
Purchase Details
Closed on
Jun 25, 2020
Sold by
Epa Enterprises Llc
Bought by
S Downing Llc
Current Estimated Value
Home Financials for this Owner
Home Financials are based on the most recent Mortgage that was taken out on this home.
Original Mortgage
$190,000
Outstanding Balance
$168,479
Interest Rate
3.1%
Mortgage Type
Stand Alone First
Estimated Equity
$313,257
Purchase Details
Closed on
May 7, 2002
Sold by
Chan Kan
Bought by
Aliaga Edward
Home Financials for this Owner
Home Financials are based on the most recent Mortgage that was taken out on this home.
Original Mortgage
$103,500
Interest Rate
6.82%
Mortgage Type
Commercial
Create a Home Valuation Report for This Property
The Home Valuation Report is an in-depth analysis detailing your home's value as well as a comparison with similar homes in the area
Home Values in the Area
Average Home Value in this Area
Purchase History
| Date | Buyer | Sale Price | Title Company |
|---|---|---|---|
| S Downing Llc | $280,000 | Land Services Usa Inc | |
| Aliaga Edward | $115,000 | -- |
Source: Public Records
Mortgage History
| Date | Status | Borrower | Loan Amount |
|---|---|---|---|
| Open | S Downing Llc | $190,000 | |
| Previous Owner | Aliaga Edward | $103,500 |
Source: Public Records
Tax History
| Year | Tax Paid | Tax Assessment Tax Assessment Total Assessment is a certain percentage of the fair market value that is determined by local assessors to be the total taxable value of land and additions on the property. | Land | Improvement |
|---|---|---|---|---|
| 2025 | $7,220 | $385,600 | $194,600 | $191,000 |
| 2024 | $7,111 | $348,800 | $167,200 | $181,600 |
Source: Public Records
Map
Nearby Homes
- 40 Church St
- 75 Broad St
- 55 E Front St
- 87 Church St
- 104 Church St
- 9 Kearney St Unit A
- 226 Osborn St
- 37 Myrtle Ave
- 72 Manchester Ave
- 74 Manchester Ave
- 162 2nd St
- 6 Octavia Place
- 9 Hurley St
- 231 Atlantic St Unit 23
- 231 Atlantic St Unit 83
- 2 Chingarora Ave
- 95 Broadway
- 2108 Florence Ave
- 104 Therese Ave
- 253 Broadway