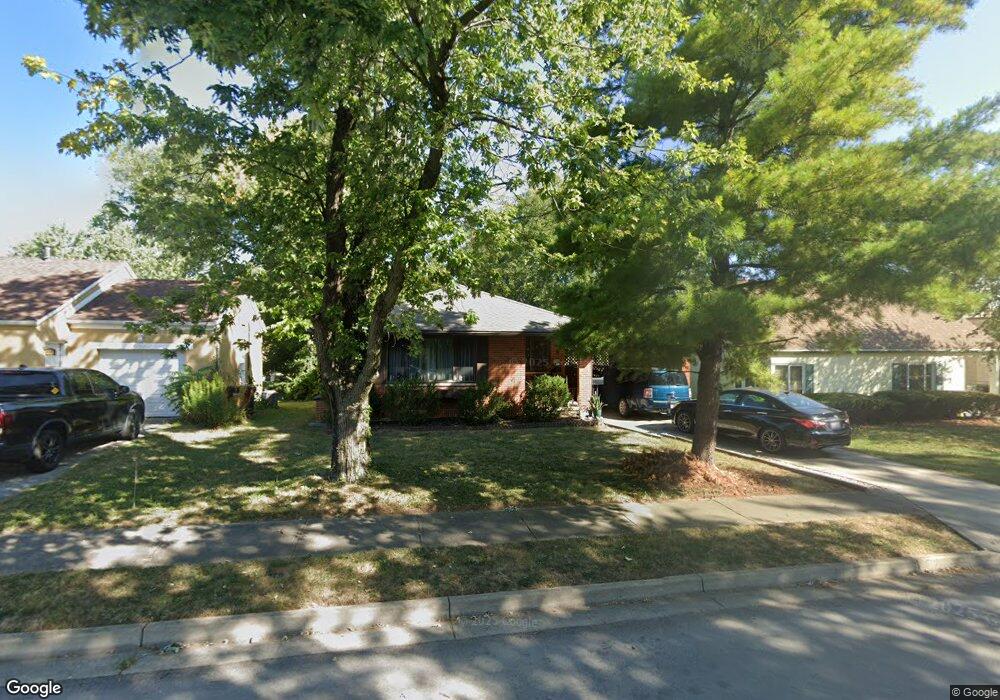
33 Overlook St Englewood, OH 45322
Estimated Value: $169,000 - $198,000
3
Beds
1
Bath
1,124
Sq Ft
$160/Sq Ft
Est. Value
About This Home
This home is located at 33 Overlook St, Englewood, OH 45322 and is currently estimated at $180,091, approximately $160 per square foot. 33 Overlook St is a home located in Montgomery County with nearby schools including Northmont High School, Trotwood Preparatory & Fitness Academy, and Salem Christian Academy.
Ownership History
Date
Name
Owned For
Owner Type
Purchase Details
Closed on
Mar 29, 2018
Sold by
Hellman James E and Hellman Carolynn
Bought by
Muntzinger Kyle R and Muntzinger Samara Kathryn
Current Estimated Value
Home Financials for this Owner
Home Financials are based on the most recent Mortgage that was taken out on this home.
Original Mortgage
$112,917
Outstanding Balance
$99,871
Interest Rate
5.75%
Mortgage Type
FHA
Estimated Equity
$80,220
Purchase Details
Closed on
Jun 8, 2017
Sold by
Secretary Of Hud
Bought by
Hellman James E and Hellman Carolynn
Purchase Details
Closed on
Jan 17, 2017
Sold by
Penwell Gregory R
Bought by
Pnc Bank Na
Purchase Details
Closed on
Jan 6, 2017
Sold by
Pnc Bank Na
Bought by
The Secretary Of Hud
Purchase Details
Closed on
Aug 4, 2003
Sold by
Penwell Terri A and Penwell Terri A
Bought by
Penwell Gregory R and Katzenbach Tina M
Home Financials for this Owner
Home Financials are based on the most recent Mortgage that was taken out on this home.
Original Mortgage
$85,107
Interest Rate
5.31%
Mortgage Type
FHA
Purchase Details
Closed on
Apr 23, 1994
Sold by
Jones Mark E and Jones Mary Ellen
Bought by
Penwell Terri A
Create a Home Valuation Report for This Property
The Home Valuation Report is an in-depth analysis detailing your home's value as well as a comparison with similar homes in the area
Home Values in the Area
Average Home Value in this Area
Purchase History
| Date | Buyer | Sale Price | Title Company |
|---|---|---|---|
| Muntzinger Kyle R | $115,000 | Sterling Land Title Agency I | |
| Hellman James E | $47,000 | None Available | |
| Pnc Bank Na | $40,000 | None Available | |
| The Secretary Of Hud | -- | None Available | |
| Penwell Gregory R | $85,800 | Fidelity Land Title Agency L | |
| Penwell Terri A | -- | -- | |
| Jones Mark E | -- | -- |
Source: Public Records
Mortgage History
| Date | Status | Borrower | Loan Amount |
|---|---|---|---|
| Open | Muntzinger Kyle R | $112,917 | |
| Previous Owner | Penwell Gregory R | $85,107 |
Source: Public Records
Tax History Compared to Growth
Tax History
| Year | Tax Paid | Tax Assessment Tax Assessment Total Assessment is a certain percentage of the fair market value that is determined by local assessors to be the total taxable value of land and additions on the property. | Land | Improvement |
|---|---|---|---|---|
| 2024 | $3,016 | $52,830 | $8,680 | $44,150 |
| 2023 | $3,016 | $52,830 | $8,680 | $44,150 |
| 2022 | $2,924 | $39,430 | $6,480 | $32,950 |
| 2021 | $2,932 | $39,430 | $6,480 | $32,950 |
| 2020 | $2,879 | $39,430 | $6,480 | $32,950 |
| 2019 | $1,618 | $19,750 | $6,170 | $13,580 |
| 2018 | $1,588 | $19,750 | $6,170 | $13,580 |
| 2017 | $1,960 | $24,600 | $6,170 | $18,430 |
| 2016 | $1,930 | $23,810 | $6,170 | $17,640 |
| 2015 | $1,766 | $23,810 | $6,170 | $17,640 |
| 2014 | $1,766 | $23,810 | $6,170 | $17,640 |
| 2012 | -- | $27,180 | $6,160 | $21,020 |
Source: Public Records
Map
Nearby Homes
- 31 Overlook St
- 35 Overlook St
- 37 Overlook St
- 26 Chestnut St
- 28 Chestnut St
- 16 Chestnut St
- 202 S Walnut St
- 32 Overlook St
- 30 Chestnut St
- 30 Overlook St
- 28 Overlook St
- 109 S Main St
- 109 S Main St
- 113 S Main St
- 204 S Walnut St
- 109 S Walnut St
- 105 Overlook St
- 201 S Walnut St
- 105 S Walnut St
- 103 S Walnut St