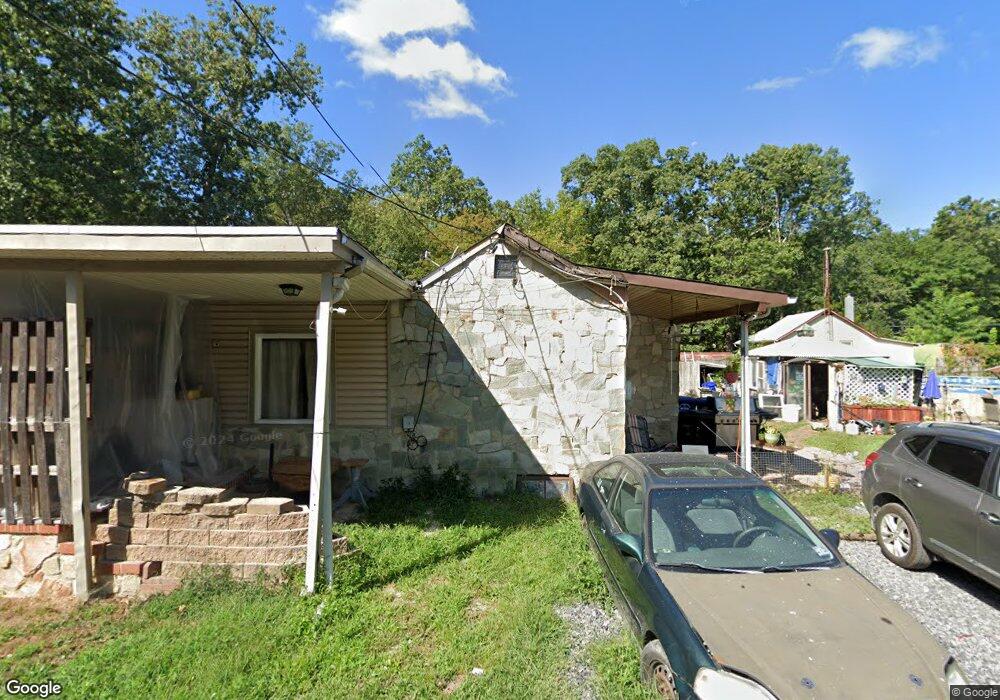
33 Phlox St Browns Mills, NJ 08015
Estimated Value: $308,000 - $377,000
2
Beds
1
Bath
1,513
Sq Ft
$227/Sq Ft
Est. Value
About This Home
This home is located at 33 Phlox St, Browns Mills, NJ 08015 and is currently estimated at $342,776, approximately $226 per square foot. 33 Phlox St is a home located in Burlington County.
Ownership History
Date
Name
Owned For
Owner Type
Purchase Details
Closed on
Sep 10, 2009
Sold by
U S Bank National Association
Bought by
Preis George
Current Estimated Value
Purchase Details
Closed on
Nov 10, 2008
Sold by
Karschner Erin B and Karschner John
Bought by
Us Bank National Association
Purchase Details
Closed on
Oct 25, 2002
Sold by
Mountain Harry E and Mountain Joyce L
Bought by
Karschner Erin B
Home Financials for this Owner
Home Financials are based on the most recent Mortgage that was taken out on this home.
Original Mortgage
$73,600
Interest Rate
6.07%
Mortgage Type
Purchase Money Mortgage
Create a Home Valuation Report for This Property
The Home Valuation Report is an in-depth analysis detailing your home's value as well as a comparison with similar homes in the area
Home Values in the Area
Average Home Value in this Area
Purchase History
| Date | Buyer | Sale Price | Title Company |
|---|---|---|---|
| Preis George | $92,000 | None Available | |
| Us Bank National Association | -- | Land Title Services Nj Inc | |
| Karschner Erin B | $92,900 | Congress Title |
Source: Public Records
Mortgage History
| Date | Status | Borrower | Loan Amount |
|---|---|---|---|
| Previous Owner | Karschner Erin B | $73,600 |
Source: Public Records
Tax History Compared to Growth
Tax History
| Year | Tax Paid | Tax Assessment Tax Assessment Total Assessment is a certain percentage of the fair market value that is determined by local assessors to be the total taxable value of land and additions on the property. | Land | Improvement |
|---|---|---|---|---|
| 2025 | $6,115 | $199,500 | $42,000 | $157,500 |
| 2024 | $5,738 | $199,500 | $42,000 | $157,500 |
| 2023 | $5,738 | $199,500 | $42,000 | $157,500 |
| 2021 | $5,093 | $199,500 | $42,000 | $157,500 |
| 2020 | $4,902 | $199,500 | $42,000 | $157,500 |
| 2019 | $4,694 | $199,500 | $42,000 | $157,500 |
| 2018 | $4,535 | $199,500 | $42,000 | $157,500 |
| 2017 | $4,441 | $199,500 | $42,000 | $157,500 |
| 2016 | $3,461 | $92,600 | $25,400 | $67,200 |
| 2015 | $3,434 | $92,600 | $25,400 | $67,200 |
| 2014 | $3,283 | $92,600 | $25,400 | $67,200 |
Source: Public Records
Map
Nearby Homes