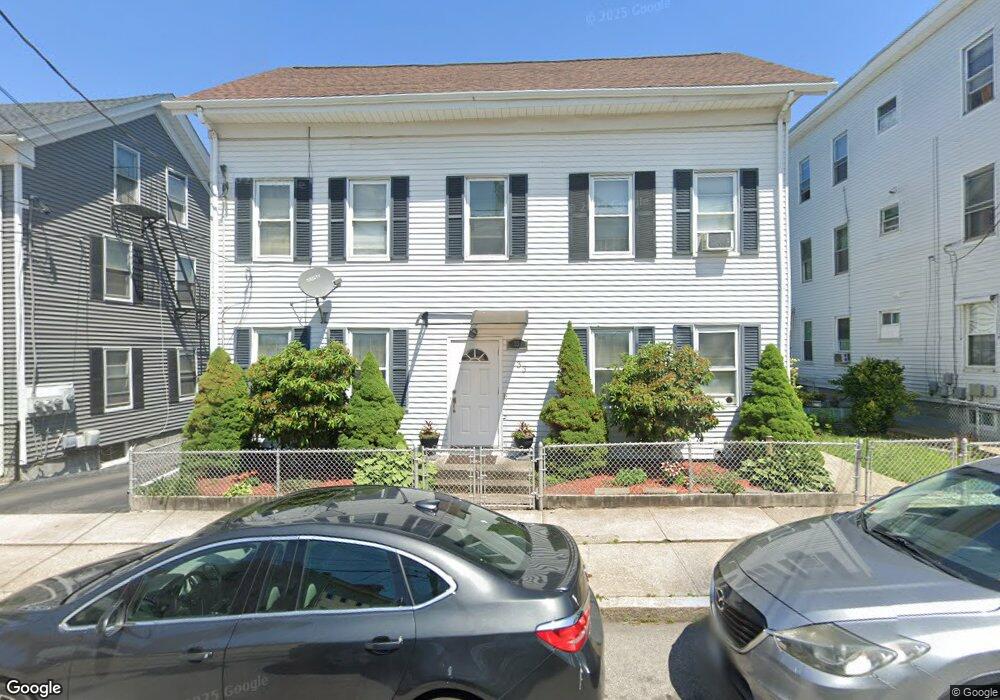
33 Pine St Pawtucket, RI 02860
Woodlawn NeighborhoodEstimated Value: $477,090 - $594,000
7
Beds
4
Baths
2,673
Sq Ft
$208/Sq Ft
Est. Value
About This Home
This home is located at 33 Pine St, Pawtucket, RI 02860 and is currently estimated at $555,523, approximately $207 per square foot. 33 Pine St is a home located in Providence County with nearby schools including International Charter School, Blackstone Academy Charter School, and Saint Raphael Academy.
Ownership History
Date
Name
Owned For
Owner Type
Purchase Details
Closed on
May 5, 2004
Sold by
Amado Marcelle P
Bought by
Ngibuini Richard
Current Estimated Value
Home Financials for this Owner
Home Financials are based on the most recent Mortgage that was taken out on this home.
Original Mortgage
$238,753
Outstanding Balance
$106,835
Interest Rate
5.39%
Mortgage Type
Purchase Money Mortgage
Estimated Equity
$448,688
Purchase Details
Closed on
Jul 17, 1995
Sold by
Clement Julie A
Bought by
Lima Marcelle P
Create a Home Valuation Report for This Property
The Home Valuation Report is an in-depth analysis detailing your home's value as well as a comparison with similar homes in the area
Home Values in the Area
Average Home Value in this Area
Purchase History
| Date | Buyer | Sale Price | Title Company |
|---|---|---|---|
| Ngibuini Richard | $242,500 | -- | |
| Lima Marcelle P | $94,000 | -- |
Source: Public Records
Mortgage History
| Date | Status | Borrower | Loan Amount |
|---|---|---|---|
| Open | Lima Marcelle P | $28,988 | |
| Open | Lima Marcelle P | $238,753 | |
| Previous Owner | Lima Marcelle P | $148,500 |
Source: Public Records
Tax History
| Year | Tax Paid | Tax Assessment Tax Assessment Total Assessment is a certain percentage of the fair market value that is determined by local assessors to be the total taxable value of land and additions on the property. | Land | Improvement |
|---|---|---|---|---|
| 2025 | $5,490 | $417,500 | $86,700 | $330,800 |
| 2024 | $5,152 | $417,500 | $86,700 | $330,800 |
| 2023 | $4,413 | $260,500 | $42,800 | $217,700 |
| 2022 | $4,319 | $260,500 | $42,800 | $217,700 |
| 2021 | $4,319 | $260,500 | $42,800 | $217,700 |
| 2020 | $4,042 | $193,500 | $60,600 | $132,900 |
| 2019 | $4,042 | $193,500 | $60,600 | $132,900 |
| 2018 | $3,895 | $193,500 | $60,600 | $132,900 |
| 2017 | $4,365 | $192,100 | $75,800 | $116,300 |
| 2016 | $4,205 | $192,100 | $75,800 | $116,300 |
| 2015 | $4,205 | $192,100 | $75,800 | $116,300 |
| 2014 | $3,867 | $167,700 | $88,400 | $79,300 |
Source: Public Records
Map
Nearby Homes
Your Personal Tour Guide
Ask me questions while you tour the home.