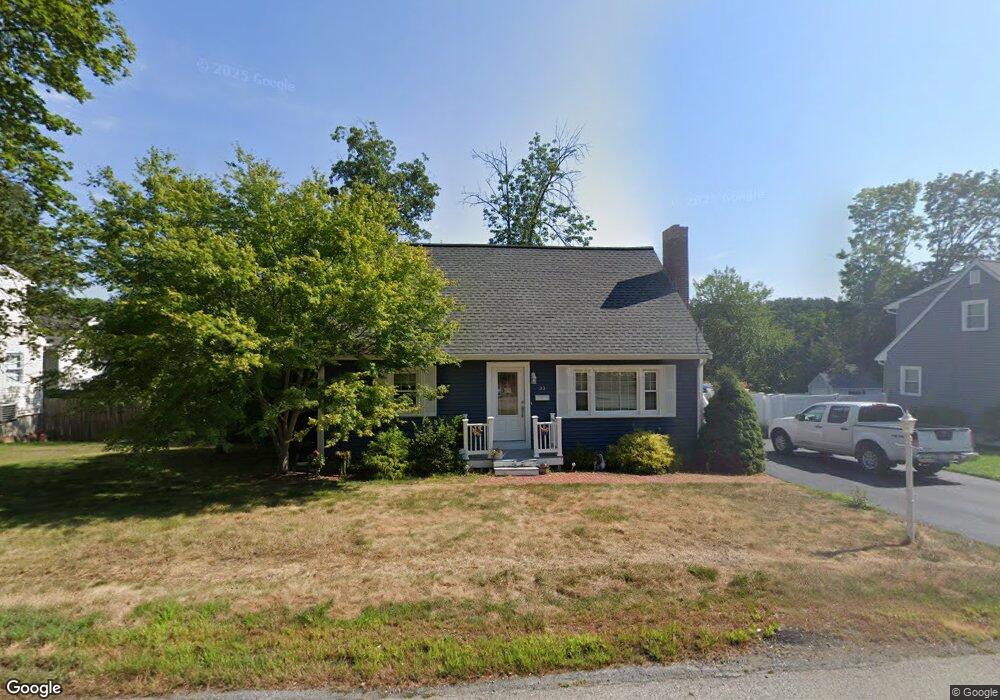
33 Purity Springs Rd Burlington, MA 01803
Havenville NeighborhoodEstimated Value: $706,000 - $764,531
2
Beds
2
Baths
1,428
Sq Ft
$518/Sq Ft
Est. Value
About This Home
This home is located at 33 Purity Springs Rd, Burlington, MA 01803 and is currently estimated at $739,133, approximately $517 per square foot. 33 Purity Springs Rd is a home located in Middlesex County with nearby schools including Burlington High School, Marshall Simonds Middle School, and Mount Hope Christian School.
Ownership History
Date
Name
Owned For
Owner Type
Purchase Details
Closed on
Mar 14, 2003
Sold by
Visram Annamaria and Visram Nazir
Bought by
Neves Lori A
Current Estimated Value
Home Financials for this Owner
Home Financials are based on the most recent Mortgage that was taken out on this home.
Original Mortgage
$264,000
Outstanding Balance
$113,990
Interest Rate
5.94%
Mortgage Type
Purchase Money Mortgage
Estimated Equity
$625,143
Purchase Details
Closed on
Nov 27, 2000
Sold by
Marsocci David A and Marsocci Gail M
Bought by
Visram Nazir and Visram Annamaria
Home Financials for this Owner
Home Financials are based on the most recent Mortgage that was taken out on this home.
Original Mortgage
$200,000
Interest Rate
7.78%
Mortgage Type
Purchase Money Mortgage
Purchase Details
Closed on
May 31, 1996
Sold by
Ziobro Thomas A
Bought by
Marsocci David A and Guidara Gail M
Create a Home Valuation Report for This Property
The Home Valuation Report is an in-depth analysis detailing your home's value as well as a comparison with similar homes in the area
Home Values in the Area
Average Home Value in this Area
Purchase History
| Date | Buyer | Sale Price | Title Company |
|---|---|---|---|
| Neves Lori A | $330,000 | -- | |
| Visram Nazir | $260,000 | -- | |
| Marsocci David A | $158,000 | -- | |
| Marsocci David A | $158,000 | -- |
Source: Public Records
Mortgage History
| Date | Status | Borrower | Loan Amount |
|---|---|---|---|
| Open | Neves Lori A | $264,000 | |
| Previous Owner | Marsocci David A | $190,000 | |
| Previous Owner | Marsocci David A | $200,000 | |
| Previous Owner | Marsocci David A | $153,000 |
Source: Public Records
Tax History Compared to Growth
Tax History
| Year | Tax Paid | Tax Assessment Tax Assessment Total Assessment is a certain percentage of the fair market value that is determined by local assessors to be the total taxable value of land and additions on the property. | Land | Improvement |
|---|---|---|---|---|
| 2025 | $5,223 | $603,100 | $384,100 | $219,000 |
| 2024 | $5,097 | $570,100 | $350,700 | $219,400 |
| 2023 | $4,873 | $518,400 | $303,900 | $214,500 |
| 2022 | $4,704 | $472,800 | $276,400 | $196,400 |
| 2021 | $6,866 | $455,300 | $258,900 | $196,400 |
| 2020 | $4,357 | $452,000 | $254,700 | $197,300 |
| 2019 | $4,264 | $406,900 | $238,000 | $168,900 |
| 2018 | $4,174 | $393,000 | $231,300 | $161,700 |
| 2017 | $9,679 | $393,000 | $231,300 | $161,700 |
| 2016 | $4,084 | $356,400 | $200,400 | $156,000 |
| 2015 | $4,045 | $356,400 | $200,400 | $156,000 |
| 2014 | $3,936 | $328,000 | $178,700 | $149,300 |
Source: Public Records
Map
Nearby Homes
- 27 Purity Springs Rd
- 6 Arthur Woods Ave
- 20 Lantern Ln
- 12 Murray Ave Unit 18
- 10 Murray Ave Unit 15
- 1 Violet Rd
- 68 Macon Rd
- 42 Lantern Ln
- 11 Violet Rd
- 3 County Rd
- 9 Wing Terrace
- 2 Cutting Ln
- 12 Pleasant St
- 129 Cambridge St Unit 1
- 51 Terrace Hall Ave
- 17 Evelyn St
- 38 Freeport Dr
- 1 Hallmark Gardens Unit 8
- 5 Hallmark Gardens Unit 7
- 210 Winn St
- 31 Purity Springs Rd
- 35 Purity Springs Rd
- 3 Forest Rd
- 5 Forest Rd
- 1 Forest Rd
- 37 Purity Springs Rd
- 38 Purity Springs Rd
- 15 Glenwood St
- 32 Purity Springs Rd
- 13 Glenwood St
- 7 Forest Rd
- 36 Purity Springs Rd
- 39 Purity Springs Rd
- 44 Purity Springs Rd
- 41 Carey Ave
- 9 Forest Rd
- 30 Purity Springs Rd
- 11 Glenwood St
- 6 Forest Rd
- 41 Purity Springs Rd