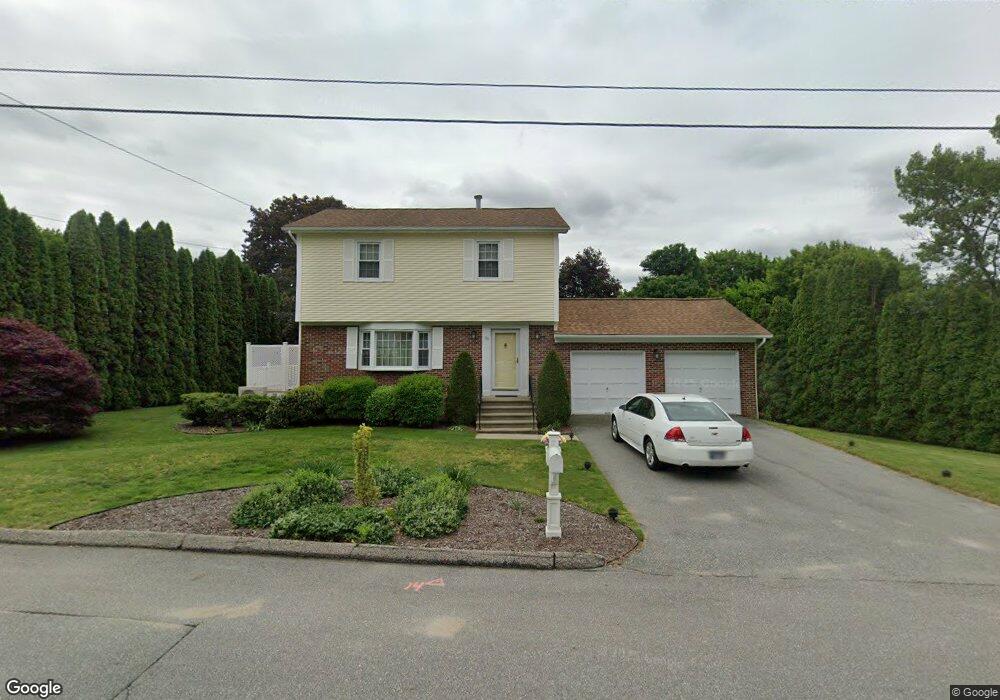
33 River Dr Johnston, RI 02919
Thornton NeighborhoodEstimated Value: $435,943 - $492,000
3
Beds
2
Baths
1,400
Sq Ft
$329/Sq Ft
Est. Value
About This Home
This home is located at 33 River Dr, Johnston, RI 02919 and is currently estimated at $461,236, approximately $329 per square foot. 33 River Dr is a home located in Providence County with nearby schools including Johnston Senior High School, Achievement First Promesa, and St Rocco School.
Ownership History
Date
Name
Owned For
Owner Type
Purchase Details
Closed on
Jul 21, 2011
Sold by
Tortolani Marha and Tice Delores L
Bought by
Johnston Town Of
Current Estimated Value
Purchase Details
Closed on
Aug 20, 1993
Sold by
Pichette Robert A and Pichette Catherine
Bought by
Dinucci Thomas J and Dinucci Alice
Home Financials for this Owner
Home Financials are based on the most recent Mortgage that was taken out on this home.
Original Mortgage
$110,000
Interest Rate
7.11%
Create a Home Valuation Report for This Property
The Home Valuation Report is an in-depth analysis detailing your home's value as well as a comparison with similar homes in the area
Home Values in the Area
Average Home Value in this Area
Purchase History
We collect this data history from publicly available records. To have your information removed, we recommend requesting removal directly through your county’s website.
| Date | Buyer | Sale Price | Title Company |
|---|---|---|---|
| Johnston Town Of | $136,000 | -- | |
| Dinucci Thomas J | $130,000 | -- | |
| Johnston Town Of | $136,000 | -- | |
| Dinucci Thomas J | $130,000 | -- |
Source: Public Records
Mortgage History
We collect this data history from publicly available records. To have your information removed, we recommend requesting removal directly through your county’s website.
| Date | Status | Borrower | Loan Amount |
|---|---|---|---|
| Previous Owner | Dinucci Thomas J | $99,000 | |
| Previous Owner | Dinucci Thomas J | $10,000 | |
| Previous Owner | Dinucci Thomas J | $110,000 |
Source: Public Records
Tax History
| Year | Tax Paid | Tax Assessment Tax Assessment Total Assessment is a certain percentage of the fair market value that is determined by local assessors to be the total taxable value of land and additions on the property. | Land | Improvement |
|---|---|---|---|---|
| 2025 | $5,300 | $339,300 | $98,300 | $241,000 |
| 2024 | $5,191 | $339,300 | $98,300 | $241,000 |
| 2023 | $5,191 | $339,300 | $98,300 | $241,000 |
| 2022 | $3,361 | $230,800 | $75,500 | $155,300 |
| 2021 | $5,364 | $230,800 | $75,500 | $155,300 |
| 2018 | $5,591 | $203,400 | $59,300 | $144,100 |
| 2016 | $7,423 | $204,100 | $59,300 | $144,800 |
| 2015 | $5,465 | $188,500 | $62,000 | $126,500 |
| 2014 | $4,336 | $188,500 | $62,000 | $126,500 |
| 2013 | $5,419 | $188,500 | $62,000 | $126,500 |
Source: Public Records
Map
Nearby Homes
- 4 Heritage Cir
- 0 Myrtle Ave
- 30 Sprague Cir
- 0 Plainfield Pike Unit 1411477
- 50 Clemence St Unit 50
- 62 Maple Ave
- 5 Mill St
- 0 Clemence St
- 4 Sprague Cir
- 7 Hemlock Dr
- 3 Hemlock Dr
- 36 Abatecola Way
- 1448 Plainfield Pike
- 60 Imperial Ave
- 33 Abatecola Way
- 77 Rockwood Ave
- 8 Deluca St
- 47 Morgan Ave Unit 29
- 83 Valente Dr
- 0 Ipswich St
Your Personal Tour Guide
Ask me questions while you tour the home.