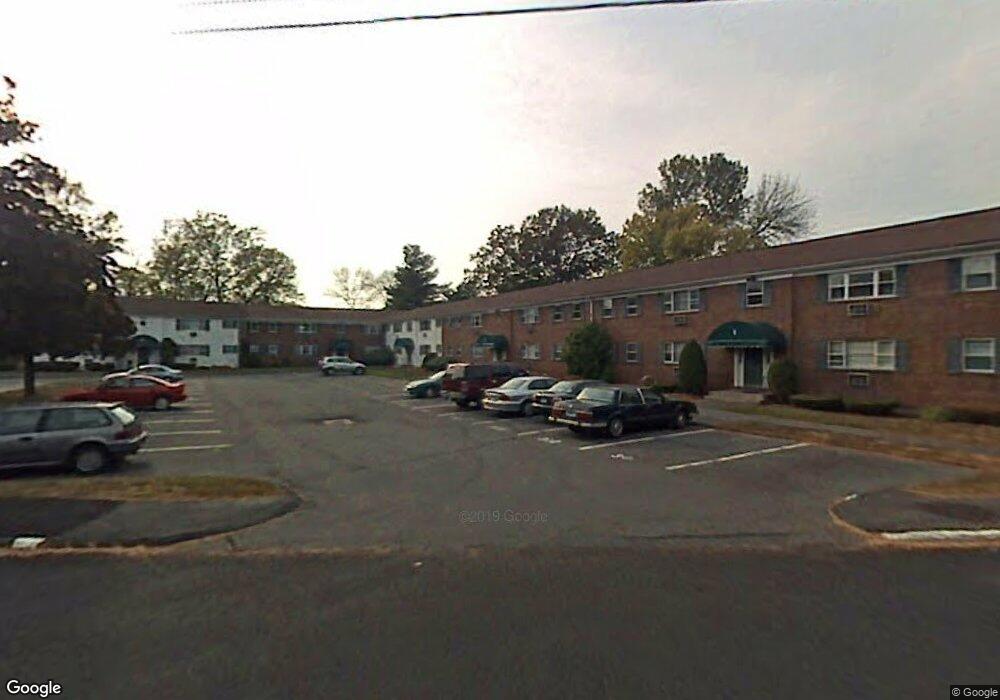
33 Robbins Ln Unit A Rocky Hill, CT 06067
Estimated Value: $133,000 - $149,000
1
Bed
1
Bath
672
Sq Ft
$208/Sq Ft
Est. Value
About This Home
This home is located at 33 Robbins Ln Unit A, Rocky Hill, CT 06067 and is currently estimated at $139,925, approximately $208 per square foot. 33 Robbins Ln Unit A is a home located in Hartford County with nearby schools including Albert D. Griswold Middle School, Rocky Hill High School, and Corpus Christi School.
Ownership History
Date
Name
Owned For
Owner Type
Purchase Details
Closed on
Jan 29, 2018
Sold by
33A Robbins Lane Llc
Bought by
K Greenfield Llc
Current Estimated Value
Purchase Details
Closed on
Apr 12, 2012
Sold by
Henderson Mark and Pass Leonard T
Bought by
Thompson Gary
Home Financials for this Owner
Home Financials are based on the most recent Mortgage that was taken out on this home.
Original Mortgage
$50,000
Interest Rate
3.91%
Purchase Details
Closed on
Feb 23, 2012
Sold by
Relihan Mary M
Bought by
Pass Leonard T and Henderson Mark F
Home Financials for this Owner
Home Financials are based on the most recent Mortgage that was taken out on this home.
Original Mortgage
$50,000
Interest Rate
3.91%
Purchase Details
Closed on
Aug 20, 2010
Sold by
Relihan Bernard J
Bought by
Relihan Mary M
Create a Home Valuation Report for This Property
The Home Valuation Report is an in-depth analysis detailing your home's value as well as a comparison with similar homes in the area
Home Values in the Area
Average Home Value in this Area
Purchase History
| Date | Buyer | Sale Price | Title Company |
|---|---|---|---|
| K Greenfield Llc | $70,000 | -- | |
| K Greenfield Llc | $70,000 | -- | |
| Thompson Gary | $60,000 | -- | |
| Thompson Gary | $60,000 | -- | |
| Pass Leonard T | $50,000 | -- | |
| Pass Leonard T | $50,000 | -- | |
| Relihan Mary M | -- | -- | |
| Relihan Mary M | -- | -- |
Source: Public Records
Mortgage History
| Date | Status | Borrower | Loan Amount |
|---|---|---|---|
| Previous Owner | Relihan Mary M | $50,000 |
Source: Public Records
Tax History Compared to Growth
Tax History
| Year | Tax Paid | Tax Assessment Tax Assessment Total Assessment is a certain percentage of the fair market value that is determined by local assessors to be the total taxable value of land and additions on the property. | Land | Improvement |
|---|---|---|---|---|
| 2025 | $2,212 | $73,150 | $0 | $73,150 |
| 2024 | $2,134 | $73,150 | $0 | $73,150 |
| 2023 | $1,730 | $48,160 | $0 | $48,160 |
| 2022 | $1,662 | $48,160 | $0 | $48,160 |
| 2021 | $1,752 | $51,380 | $0 | $51,380 |
| 2020 | $1,726 | $51,380 | $0 | $51,380 |
| 2019 | $1,670 | $51,380 | $0 | $51,380 |
| 2018 | $1,383 | $42,700 | $0 | $42,700 |
| 2017 | $1,427 | $45,150 | $0 | $45,150 |
| 2016 | $1,400 | $45,150 | $0 | $45,150 |
| 2015 | $1,341 | $45,150 | $0 | $45,150 |
| 2014 | $1,341 | $45,150 | $0 | $45,150 |
Source: Public Records
Map
Nearby Homes
- 15 Marshall Rd
- 1610 Silas Deane Hwy
- 28 Colonial Dr Unit D
- 12 Colonial Dr Unit C
- 18 Colonial Dr Unit A
- 59 Chapin Ave
- 71 Joiners Rd
- 4 Lexington Ct
- 37 Deming Rd
- 88 Elm St
- 650 Maple St
- 507 Cedar Hollow Dr
- 40 Grimes Rd
- 32 Wright Rd
- 34 Clayton Dr
- 211 Fairlane Dr
- 19 Brookwood Dr Unit C
- 89 Gilbert Ave
- 71 Brookwood Dr Unit D
- 102 Brookwood Dr Unit D
- 33 Robbins Ln Unit D
- 33 Robbins Ln Unit C
- 33 Robbins Ln Unit B
- 35 Robbins Ln Unit D
- 35 Robbins Ln Unit C
- 35 Robbins Ln Unit B
- 35 Robbins Ln Unit A
- 31 Robbins Ln Unit D
- 31 Robbins Ln Unit C
- 31 Robbins Ln Unit B
- 31 Robbins Ln Unit A
- 41 Marshall Rd Unit D
- 41 Marshall Rd Unit C
- 41 Marshall Rd Unit B
- 41 Marshall Rd Unit A
- 41 Marshall Rd
- 41 Marshall Rd
- 37 Robbins Ln Unit D
- 37 Robbins Ln Unit C
- 37 Robbins Ln Unit B