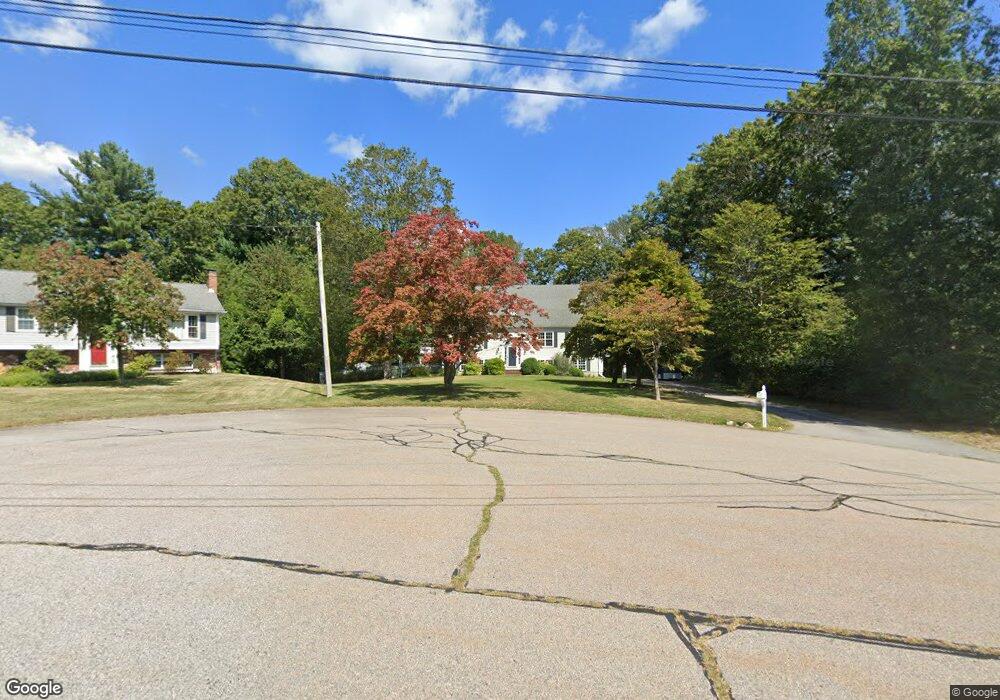
33 Roberts Rd Hanover, MA 02339
Estimated Value: $895,749 - $942,000
4
Beds
2
Baths
2,296
Sq Ft
$400/Sq Ft
Est. Value
About This Home
This home is located at 33 Roberts Rd, Hanover, MA 02339 and is currently estimated at $918,937, approximately $400 per square foot. 33 Roberts Rd is a home located in Plymouth County with nearby schools including Hanover High School, Calvary Chapel Academy, and Holy Family Elementary School.
Ownership History
Date
Name
Owned For
Owner Type
Purchase Details
Closed on
Feb 28, 2012
Sold by
Obrien Stephen F
Bought by
Stephen F Obrien 2012 and Obrien
Current Estimated Value
Purchase Details
Closed on
Sep 7, 1982
Bought by
Obrien Stephen F
Create a Home Valuation Report for This Property
The Home Valuation Report is an in-depth analysis detailing your home's value as well as a comparison with similar homes in the area
Home Values in the Area
Average Home Value in this Area
Purchase History
| Date | Buyer | Sale Price | Title Company |
|---|---|---|---|
| Stephen F Obrien 2012 | -- | -- | |
| Stephen F Obrien 2012 | -- | -- | |
| Obrien Stephen F | $40,000 | -- |
Source: Public Records
Mortgage History
| Date | Status | Borrower | Loan Amount |
|---|---|---|---|
| Previous Owner | Obrien Stephen F | $30,000 |
Source: Public Records
Tax History
| Year | Tax Paid | Tax Assessment Tax Assessment Total Assessment is a certain percentage of the fair market value that is determined by local assessors to be the total taxable value of land and additions on the property. | Land | Improvement |
|---|---|---|---|---|
| 2025 | $9,533 | $771,900 | $275,900 | $496,000 |
| 2024 | $9,300 | $724,300 | $275,900 | $448,400 |
| 2023 | $8,775 | $650,500 | $250,900 | $399,600 |
| 2022 | $9,123 | $598,200 | $250,900 | $347,300 |
| 2021 | $9,326 | $571,100 | $228,300 | $342,800 |
| 2020 | $9,220 | $565,300 | $228,300 | $337,000 |
| 2019 | $8,561 | $521,700 | $228,300 | $293,400 |
| 2018 | $8,400 | $516,000 | $228,300 | $287,700 |
| 2017 | $8,263 | $500,200 | $215,000 | $285,200 |
| 2016 | $7,857 | $466,000 | $195,300 | $270,700 |
| 2015 | $7,909 | $489,700 | $195,300 | $294,400 |
Source: Public Records
Map
Nearby Homes
- 206-208 Hinghm St
- 26 Hobart Ln Unit 26,C
- 1 Von Rhor Dr Unit 1
- 738 Whiting St
- 36 Bayberry Ln
- 18 Winterberry Ln
- 303 Pond St
- 48 Bigelow Ave
- 40 Summit St
- 7 Boxberry Ln Unit 7
- 117 Liberty St
- 63 Webster St
- 8 Blueberry Ct
- 55 Turner Rd
- 5 Blueberry Ct
- 737-739 Union St
- 46 Brookwood Rd
- 18 Colby St
- 12 Dyer St Unit 12
- 19 Dyer St Unit 19
- 37 Roberts Rd
- 23 Roberts Rd
- 168 Dwelley Ave
- 217 Ponderosa Dr
- 229 Ponderosa Dr
- 249 Ponderosa Dr
- 34 Roberts Rd
- 154 Dwelley Ave
- 26 Roberts Rd
- 11 Roberts Rd
- 16 Roberts Rd
- 232 Ponderosa Dr
- 218 Ponderosa Dr
- 142 Dwelley Ave
- 116 Dwelley Ave
- 90 Dwelley Ave
- 273 Ponderosa Dr
- LOT 3 Tiffany Mill Ln
- LOT 1 Buttercup Ln
- LOT 38 Plain St
Your Personal Tour Guide
Ask me questions while you tour the home.