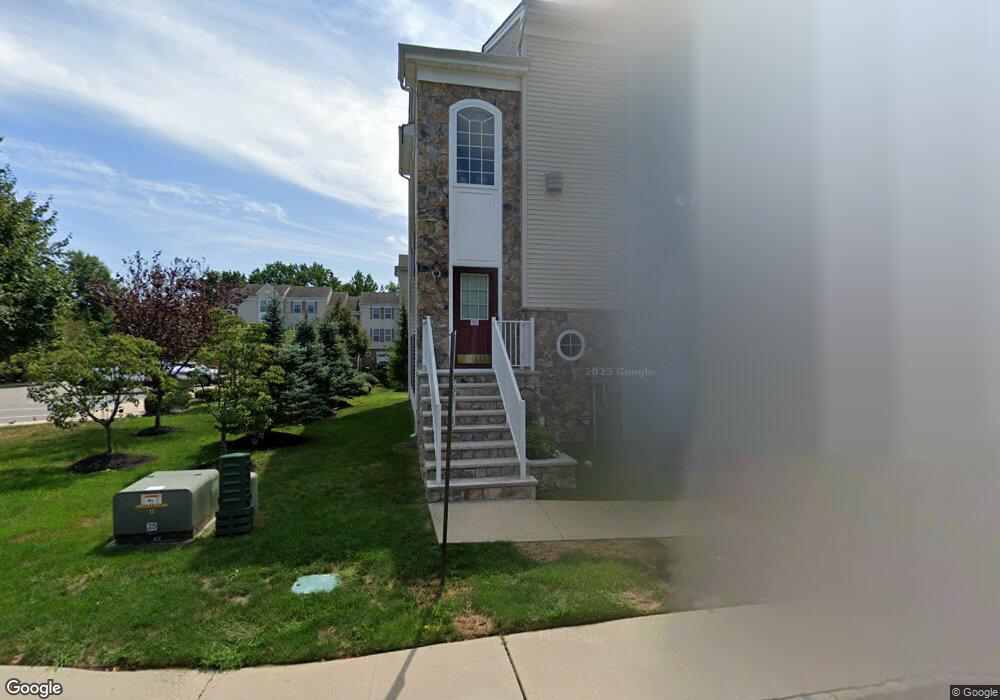
33 Russell Ct Matawan, NJ 07747
Estimated Value: $516,497 - $590,000
Studio
--
Bath
1,870
Sq Ft
$297/Sq Ft
Est. Value
About This Home
This home is located at 33 Russell Ct, Matawan, NJ 07747 and is currently estimated at $555,874, approximately $297 per square foot. 33 Russell Ct is a home located in Middlesex County with nearby schools including Old Bridge High School, Minding Miracles Learning Center, and Matawan Montessori Academy.
Ownership History
Date
Name
Owned For
Owner Type
Purchase Details
Closed on
Feb 18, 2005
Sold by
Kara At Farrington Ridge Llc
Bought by
Barbato Anthony and Barbato Dyane
Current Estimated Value
Home Financials for this Owner
Home Financials are based on the most recent Mortgage that was taken out on this home.
Original Mortgage
$296,000
Outstanding Balance
$149,561
Interest Rate
5.66%
Mortgage Type
New Conventional
Estimated Equity
$406,313
Create a Home Valuation Report for This Property
The Home Valuation Report is an in-depth analysis detailing your home's value as well as a comparison with similar homes in the area
Home Values in the Area
Average Home Value in this Area
Purchase History
| Date | Buyer | Sale Price | Title Company |
|---|---|---|---|
| Barbato Anthony | $341,823 | -- | |
| -- | $341,800 | -- |
Source: Public Records
Mortgage History
| Date | Status | Borrower | Loan Amount |
|---|---|---|---|
| Open | -- | $296,000 | |
| Closed | -- | $296,000 |
Source: Public Records
Tax History
| Year | Tax Paid | Tax Assessment Tax Assessment Total Assessment is a certain percentage of the fair market value that is determined by local assessors to be the total taxable value of land and additions on the property. | Land | Improvement |
|---|---|---|---|---|
| 2025 | $8,220 | $143,000 | $64,800 | $78,200 |
| 2024 | $7,896 | $143,000 | $64,800 | $78,200 |
Source: Public Records
Map
Nearby Homes
- 53 Thorne Ln
- 109 Fawn Dr
- 18 Rachele Ct
- 4 Janis Ct
- 12 Euclid Rd
- 138 Washington Ave
- 11 Spyros Dr
- 106 Athens Ave
- 95 Athens Ave
- 78 Washington Ave
- 25 Venus Rd
- 32 Athens Ave
- 56 Washington Ave
- 72 Haven Dr Unit D
- 72 Haven Dr Unit 500
- 38 Galewood Dr Unit 647
- 38 Galewood Dr
- 4 Old Bridge Plaza
- 9 Valery Rd Unit 651
- 9 Valery Rd
Your Personal Tour Guide
Ask me questions while you tour the home.