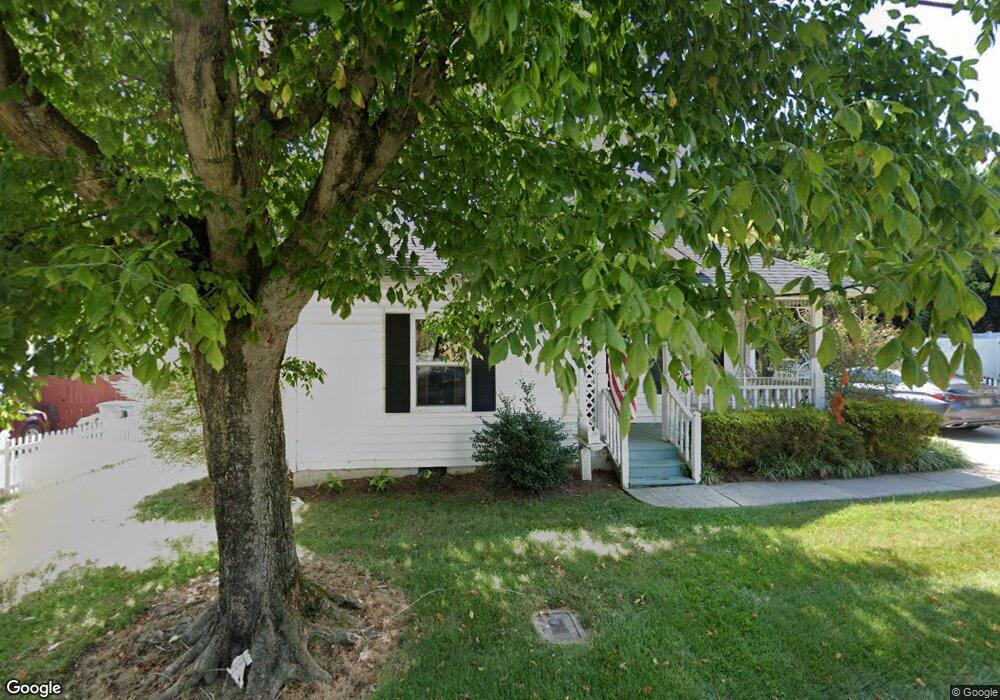
33 S 10th St Belmont, NC 28012
Estimated Value: $284,000 - $304,000
2
Beds
1
Bath
1,120
Sq Ft
$262/Sq Ft
Est. Value
About This Home
This home is located at 33 S 10th St, Belmont, NC 28012 and is currently estimated at $292,960, approximately $261 per square foot. 33 S 10th St is a home located in Gaston County with nearby schools including J B Page Elementary School, Belmont Central Elementary School, and Belmont Middle School.
Ownership History
Date
Name
Owned For
Owner Type
Purchase Details
Closed on
Nov 15, 2005
Sold by
Filler James E
Bought by
Byrne Julie Ann
Current Estimated Value
Home Financials for this Owner
Home Financials are based on the most recent Mortgage that was taken out on this home.
Original Mortgage
$68,800
Outstanding Balance
$37,374
Interest Rate
5.9%
Mortgage Type
Fannie Mae Freddie Mac
Estimated Equity
$255,586
Create a Home Valuation Report for This Property
The Home Valuation Report is an in-depth analysis detailing your home's value as well as a comparison with similar homes in the area
Purchase History
We collect this data history from publicly available records. To have your information removed, we recommend requesting removal directly through your county’s website.
| Date | Buyer | Sale Price | Title Company |
|---|---|---|---|
| Byrne Julie Ann | $86,000 | -- |
Source: Public Records
Mortgage History
We collect this data history from publicly available records. To have your information removed, we recommend requesting removal directly through your county’s website.
| Date | Status | Borrower | Loan Amount |
|---|---|---|---|
| Open | Byrne Julie Ann | $68,800 | |
| Closed | Byrne Julie Ann | $17,200 |
Source: Public Records
Tax History
| Year | Tax Paid | Tax Assessment Tax Assessment Total Assessment is a certain percentage of the fair market value that is determined by local assessors to be the total taxable value of land and additions on the property. | Land | Improvement |
|---|---|---|---|---|
| 2025 | $2,620 | $248,620 | $55,000 | $193,620 |
| 2024 | $2,620 | $248,620 | $55,000 | $193,620 |
| 2023 | $2,648 | $248,620 | $55,000 | $193,620 |
| 2022 | $1,750 | $134,130 | $22,500 | $111,630 |
| 2021 | $1,804 | $134,130 | $22,500 | $111,630 |
| 2019 | $1,817 | $134,130 | $22,500 | $111,630 |
| 2018 | $1,163 | $83,977 | $14,400 | $69,577 |
| 2017 | $1,129 | $83,977 | $14,400 | $69,577 |
| 2016 | $1,129 | $83,977 | $0 | $0 |
| 2014 | $1,093 | $81,269 | $18,000 | $63,269 |
Source: Public Records
Map
Nearby Homes
- 901 Edgemont Ave
- 714 Brook St
- 211 9th St
- 100 Linestowe Dr
- 1204 E Catawba St
- 204 13th St
- 206 13th St
- 1420 River Dr Unit 10
- 589 E Catawba St
- 308 Linestowe Dr
- 235 6th St
- 211 Howe St
- 107 Howe St
- 307 6th St
- 205 Parkdale Dr
- 135 Parkdale Dr
- 5424 Amanda Ln
- 411 Ewing Dr
- 4873 Samuel Pinckney Dr
- 226 Planetree Dr
Your Personal Tour Guide
Ask me questions while you tour the home.