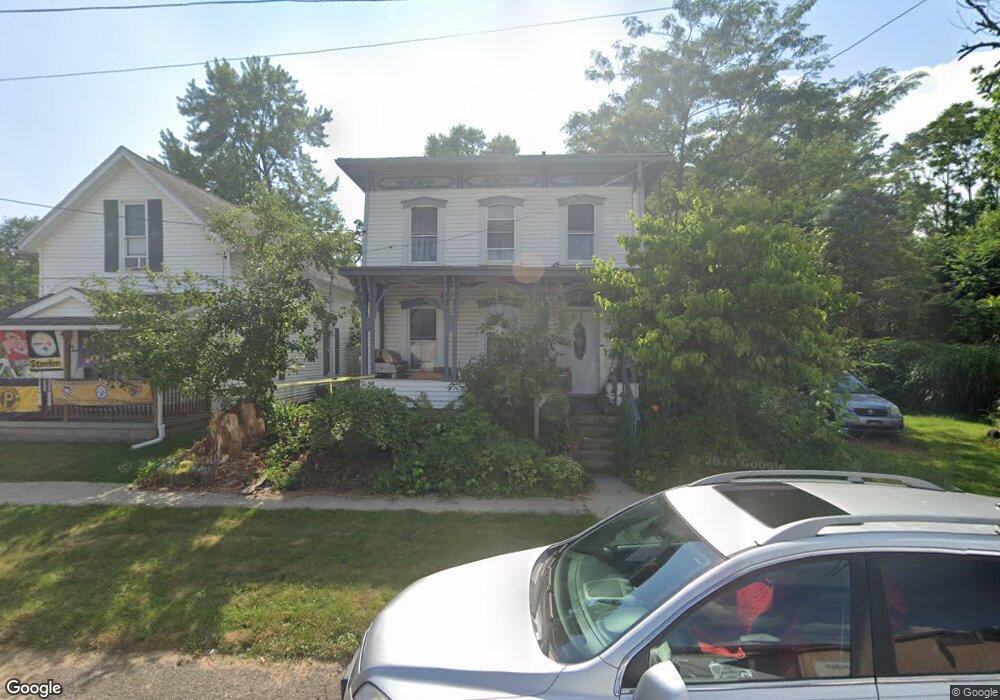
33 S 2nd St Dennison, OH 44621
Estimated Value: $89,926 - $147,000
2
Beds
1
Bath
1,544
Sq Ft
$77/Sq Ft
Est. Value
About This Home
This home is located at 33 S 2nd St, Dennison, OH 44621 and is currently estimated at $118,232, approximately $76 per square foot. 33 S 2nd St is a home located in Tuscarawas County with nearby schools including Claymont High School and Immaculate Conception School.
Ownership History
Date
Name
Owned For
Owner Type
Purchase Details
Closed on
Oct 6, 1997
Sold by
Varner Richard K
Bought by
Hallman James S and Hallman Michelle L
Current Estimated Value
Home Financials for this Owner
Home Financials are based on the most recent Mortgage that was taken out on this home.
Original Mortgage
$45,550
Outstanding Balance
$6,272
Interest Rate
7.54%
Mortgage Type
New Conventional
Estimated Equity
$111,960
Purchase Details
Closed on
May 22, 1996
Sold by
Mills Grace E
Bought by
Varner Richard K and Varner Polilli Ii
Purchase Details
Closed on
Oct 18, 1990
Sold by
Mills Lillie M and Mills Lillie M
Bought by
Mills James W & 5 Others and Michelle Lee
Create a Home Valuation Report for This Property
The Home Valuation Report is an in-depth analysis detailing your home's value as well as a comparison with similar homes in the area
Home Values in the Area
Average Home Value in this Area
Purchase History
| Date | Buyer | Sale Price | Title Company |
|---|---|---|---|
| Hallman James S | $47,000 | -- | |
| Varner Richard K | $20,000 | -- | |
| Mills James W & 5 Others | -- | -- |
Source: Public Records
Mortgage History
| Date | Status | Borrower | Loan Amount |
|---|---|---|---|
| Open | Hallman James S | $45,550 |
Source: Public Records
Tax History
| Year | Tax Paid | Tax Assessment Tax Assessment Total Assessment is a certain percentage of the fair market value that is determined by local assessors to be the total taxable value of land and additions on the property. | Land | Improvement |
|---|---|---|---|---|
| 2024 | $872 | $44,300 | $12,750 | $31,550 |
| 2023 | $578 | $44,300 | $12,750 | $31,550 |
| 2022 | $583 | $15,505 | $4,463 | $11,043 |
| 2021 | $505 | $12,503 | $3,462 | $9,041 |
| 2020 | $515 | $12,503 | $3,462 | $9,041 |
| 2019 | $494 | $12,503 | $3,462 | $9,041 |
| 2018 | $438 | $10,550 | $2,920 | $7,630 |
| 2017 | $462 | $10,550 | $2,920 | $7,630 |
| 2016 | $460 | $10,550 | $2,920 | $7,630 |
| 2014 | $779 | $17,820 | $3,240 | $14,580 |
| 2013 | $785 | $17,820 | $3,240 | $14,580 |
Source: Public Records
Map
Nearby Homes
Your Personal Tour Guide
Ask me questions while you tour the home.