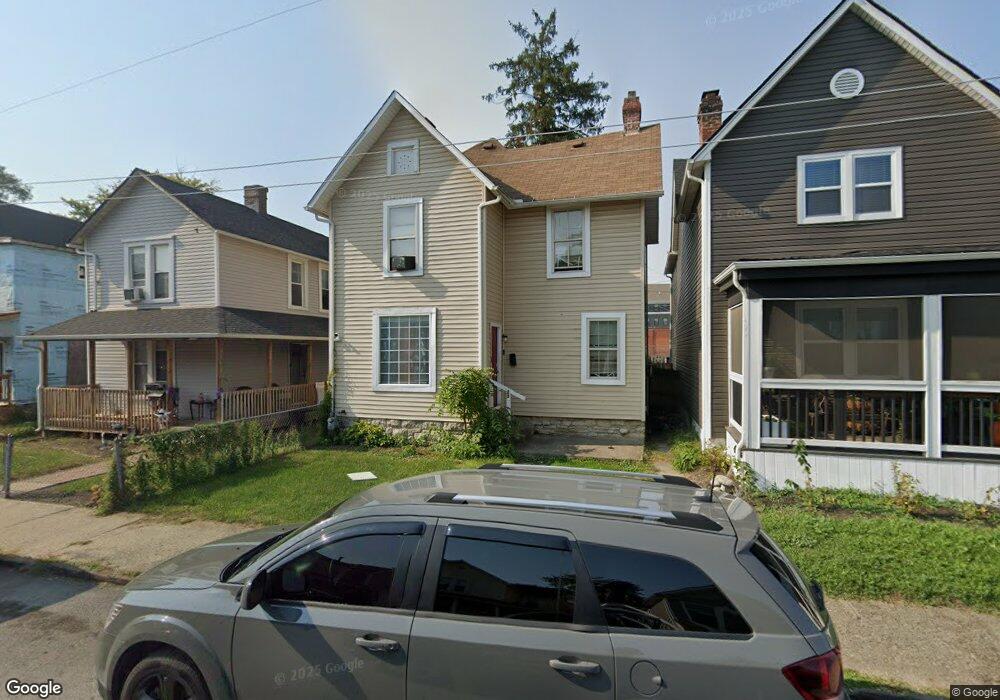
33 S Cypress Ave Columbus, OH 43222
Franklinton NeighborhoodEstimated Value: $125,000 - $160,728
3
Beds
1
Bath
1,235
Sq Ft
$110/Sq Ft
Est. Value
About This Home
This home is located at 33 S Cypress Ave, Columbus, OH 43222 and is currently estimated at $135,682, approximately $109 per square foot. 33 S Cypress Ave is a home located in Franklin County with nearby schools including Avondale Elementary School, Starling PK-8, and West High School.
Ownership History
Date
Name
Owned For
Owner Type
Purchase Details
Closed on
Sep 10, 2025
Sold by
33 Cypress Llc
Bought by
Richardson Craig
Current Estimated Value
Purchase Details
Closed on
Jan 6, 2020
Sold by
Thompson Chris
Bought by
33 Cypress Llc
Purchase Details
Closed on
Jun 29, 2011
Sold by
Square Mile Llc
Bought by
Detav Llc
Purchase Details
Closed on
May 2, 2007
Sold by
The Stillwater Asset Backed Fund Lp
Bought by
Square Mile Llc
Purchase Details
Closed on
Oct 29, 2004
Sold by
Phillips D Chandle
Bought by
Stillwater Asset Backed Fund Lp Ii
Home Financials for this Owner
Home Financials are based on the most recent Mortgage that was taken out on this home.
Original Mortgage
$52,500
Interest Rate
5.81%
Mortgage Type
Purchase Money Mortgage
Purchase Details
Closed on
Nov 20, 2003
Sold by
Jeffrey J
Bought by
J Jeffrey Properties Ltd
Purchase Details
Closed on
Mar 31, 1993
Bought by
Jeffrey J
Purchase Details
Closed on
Aug 1, 1985
Create a Home Valuation Report for This Property
The Home Valuation Report is an in-depth analysis detailing your home's value as well as a comparison with similar homes in the area
Home Values in the Area
Average Home Value in this Area
Purchase History
| Date | Buyer | Sale Price | Title Company |
|---|---|---|---|
| Richardson Craig | $126,800 | Columbus Title | |
| 33 Cypress Llc | -- | None Available | |
| Detav Llc | $13,000 | None Available | |
| Square Mile Llc | -- | Title First | |
| Stillwater Asset Backed Fund Lp Ii | -- | World Class | |
| Phillips D Chandle | $25,000 | Independent | |
| J Jeffrey Properties Ltd | -- | -- | |
| Jeffrey J | $6,100 | -- | |
| -- | $10,000 | -- |
Source: Public Records
Mortgage History
| Date | Status | Borrower | Loan Amount |
|---|---|---|---|
| Previous Owner | Phillips D Chandle | $52,500 |
Source: Public Records
Tax History Compared to Growth
Tax History
| Year | Tax Paid | Tax Assessment Tax Assessment Total Assessment is a certain percentage of the fair market value that is determined by local assessors to be the total taxable value of land and additions on the property. | Land | Improvement |
|---|---|---|---|---|
| 2024 | $4,563 | $47,990 | $6,620 | $41,370 |
| 2023 | $2,172 | $47,985 | $6,615 | $41,370 |
| 2022 | $1,192 | $14,950 | $1,160 | $13,790 |
| 2021 | $796 | $14,950 | $1,160 | $13,790 |
| 2020 | $797 | $14,950 | $1,160 | $13,790 |
| 2019 | $773 | $12,430 | $950 | $11,480 |
| 2018 | $873 | $12,430 | $950 | $11,480 |
| 2017 | $922 | $12,430 | $950 | $11,480 |
| 2016 | $1,071 | $15,760 | $1,650 | $14,110 |
| 2015 | $975 | $15,760 | $1,650 | $14,110 |
| 2014 | $326 | $5,260 | $1,650 | $3,610 |
| 2013 | $283 | $4,550 | $1,645 | $2,905 |
Source: Public Records
Map
Nearby Homes
- 61 Dakota Ave
- 112 S Cypress Ave
- 49 S Yale Ave
- 37-39 S Yale Ave
- 72 Avondale Ave
- 53-55 Hawkes Ave
- 69 Rodgers Ave
- 116 W Park Ave
- 148 W Park Ave
- 78 Hawkes Ave
- 211 Dakota Ave
- 186 Avondale Ave Unit 188
- 82 N Princeton Ave
- 1020-1026 Cable Ave
- 221 S Yale Ave
- 33 S Princeton Ave
- 144 S Princeton Ave
- 87 S Princeton Ave
- The Summit Plan at Homes on Hartford - Single Family
- 49 S Hartford Ave
- 37 S Cypress Ave
- 29 S Cypress Ave
- 41 S Cypress Ave
- 45 S Cypress Ave
- 1093 W Broad St
- 49 S Cypress Ave
- 1091 W Broad St
- 57 S Cypress Ave
- 28-30 S Cypress Ave
- 34 S Cypress Ave
- 38 S Cypress Ave
- 28 S Cypress Ave
- 59 S Cypress Ave
- 42 S Cypress Ave
- 46 S Cypress Ave
- 1089 W Broad St Unit 91
- 61 S Cypress Ave
- 1063 W Broad St
- 60 S Cypress Ave
- 63 S Cypress Ave