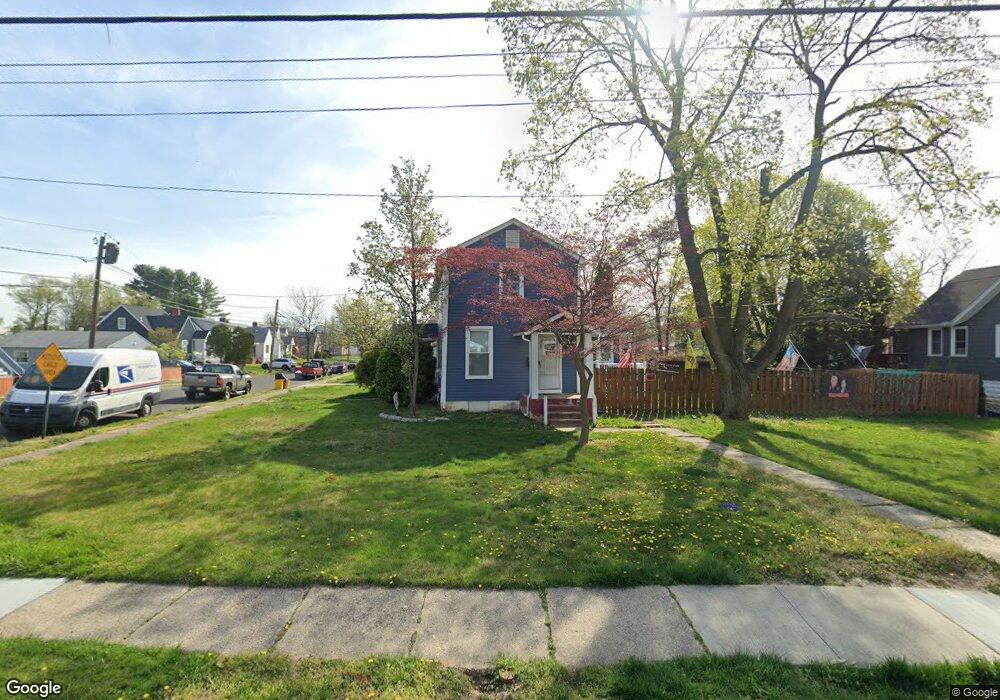
33 S Lippincott Ave Maple Shade, NJ 08052
Estimated Value: $407,966 - $462,000
--
Bed
--
Bath
2,418
Sq Ft
$184/Sq Ft
Est. Value
About This Home
This home is located at 33 S Lippincott Ave, Maple Shade, NJ 08052 and is currently estimated at $444,242, approximately $183 per square foot. 33 S Lippincott Ave is a home located in Burlington County with nearby schools including Ralph J Steinhauer Elementary School, Maude M. Wilkins Elementary School, and Howard R Yocum School.
Ownership History
Date
Name
Owned For
Owner Type
Purchase Details
Closed on
Jun 30, 2003
Sold by
Grello Steven M
Bought by
Coates Ronald and Coates Rebecca M
Current Estimated Value
Home Financials for this Owner
Home Financials are based on the most recent Mortgage that was taken out on this home.
Original Mortgage
$125,000
Outstanding Balance
$53,464
Interest Rate
5.34%
Mortgage Type
Stand Alone First
Estimated Equity
$390,778
Purchase Details
Closed on
Nov 25, 2002
Sold by
Hud
Bought by
Grello Steven M
Home Financials for this Owner
Home Financials are based on the most recent Mortgage that was taken out on this home.
Original Mortgage
$117,000
Interest Rate
6.17%
Purchase Details
Closed on
Feb 19, 2002
Sold by
Birkhimer William M and Birkhimer Terry A
Bought by
Hud
Purchase Details
Closed on
Nov 1, 1994
Sold by
Connelly Margaret L and Perrottet Margaret L
Bought by
Birkhimer William M and Birkhimer Terry A
Create a Home Valuation Report for This Property
The Home Valuation Report is an in-depth analysis detailing your home's value as well as a comparison with similar homes in the area
Home Values in the Area
Average Home Value in this Area
Purchase History
| Date | Buyer | Sale Price | Title Company |
|---|---|---|---|
| Coates Ronald | $165,000 | Congress Title Corp | |
| Grello Steven M | $130,000 | Surety Title Corp | |
| Hud | -- | -- | |
| Birkhimer William M | $98,000 | -- |
Source: Public Records
Mortgage History
| Date | Status | Borrower | Loan Amount |
|---|---|---|---|
| Open | Coates Ronald | $125,000 | |
| Previous Owner | Grello Steven M | $117,000 |
Source: Public Records
Tax History Compared to Growth
Tax History
| Year | Tax Paid | Tax Assessment Tax Assessment Total Assessment is a certain percentage of the fair market value that is determined by local assessors to be the total taxable value of land and additions on the property. | Land | Improvement |
|---|---|---|---|---|
| 2025 | $7,953 | $209,500 | $51,800 | $157,700 |
| 2024 | $7,722 | $209,500 | $51,800 | $157,700 |
| 2023 | $7,722 | $209,500 | $51,800 | $157,700 |
| 2022 | $7,603 | $209,500 | $51,800 | $157,700 |
| 2021 | $7,529 | $209,500 | $51,800 | $157,700 |
| 2020 | $7,550 | $209,500 | $51,800 | $157,700 |
| 2019 | $7,274 | $209,500 | $51,800 | $157,700 |
| 2018 | $7,148 | $209,500 | $51,800 | $157,700 |
| 2017 | $7,064 | $209,500 | $51,800 | $157,700 |
| 2016 | $6,960 | $209,500 | $51,800 | $157,700 |
| 2015 | $6,809 | $209,500 | $51,800 | $157,700 |
| 2014 | $6,601 | $209,500 | $51,800 | $157,700 |
Source: Public Records
Map
Nearby Homes
- 57 S Terrace Ave
- 22 Theodore Ave
- 112 S Maple Ave
- 29 W Broadway
- 2 Gainor Ave
- 26 N Poplar Ave
- 120 E Center Ave
- 480 W Front St
- 301 N Coles Ave
- 410 S Forklanding Rd
- 52 S Fellowship Rd
- 19 S Chestnut Ave
- 319 S Coles Ave
- 63 Mecray Ln
- 104 E Laurelton Ave
- 327 S Coles Ave
- 5 Paul Rd
- 44 S Pine Ave
- 702 E Main St
- 15 S Pine Ave
- 39 S Lippincott Ave
- 52 Helen Ave
- 43 S Lippincott Ave
- 50 Helen Ave
- 23 S Lippincott Ave
- 48 Helen Ave
- 38 S Lippincott Ave
- 32 S Lippincott Ave
- 47 S Lippincott Ave
- 42 S Lippincott Ave
- 28 S Lippincott Ave
- 19 S Lippincott Ave
- 44 Helen Ave
- 49 Helen Ave
- 51 S Lippincott Ave
- 15 S Lippincott Ave
- 51 Helen Ave
- 24 S Lippincott Ave
- 40 Helen Ave
- 44 S Lippincott Ave