33 Sagamore Dr Unit 34A Plainview, NY 11803
Estimated Value: $879,000 - $994,508
3
Beds
2
Baths
2,320
Sq Ft
$410/Sq Ft
Est. Value
About This Home
This home is located at 33 Sagamore Dr Unit 34A, Plainview, NY 11803 and is currently estimated at $952,169, approximately $410 per square foot. 33 Sagamore Dr Unit 34A is a home located in Nassau County with nearby schools including Judy Jacobs Parkway Elementary School, H B Mattlin Middle School, and Plainview-Old Bethpage John F. Kennedy High School.
Ownership History
Date
Name
Owned For
Owner Type
Purchase Details
Closed on
Dec 20, 2021
Sold by
Distinct Development Inc
Bought by
Fink Sabina
Current Estimated Value
Home Financials for this Owner
Home Financials are based on the most recent Mortgage that was taken out on this home.
Original Mortgage
$603,000
Interest Rate
3.55%
Mortgage Type
New Conventional
Purchase Details
Closed on
Jun 28, 2021
Sold by
Wells Fargo Bank
Bought by
Distinct Development Inc
Purchase Details
Closed on
Dec 17, 2019
Sold by
Nassau County Referee
Bought by
Wells Fargo Bank Na
Purchase Details
Closed on
Apr 18, 2002
Sold by
The Hamlet On Olde Oyster Bay
Bought by
Borack Roslyn
Create a Home Valuation Report for This Property
The Home Valuation Report is an in-depth analysis detailing your home's value as well as a comparison with similar homes in the area
Home Values in the Area
Average Home Value in this Area
Purchase History
| Date | Buyer | Sale Price | Title Company |
|---|---|---|---|
| Fink Sabina | $670,000 | Judicial Title | |
| Fink Sabina | $670,000 | Judicial Title | |
| Fink Sabina | $670,000 | Judicial Title | |
| Distinct Development Inc | $495,000 | None Available | |
| Distinct Development Inc | $495,000 | None Available | |
| Distinct Development Inc | $495,000 | None Available | |
| Wells Fargo Bank Na | $537,940 | None Available | |
| Wells Fargo Bank Na | $537,940 | None Available | |
| Wells Fargo Bank Na | $537,940 | None Available | |
| Borack Roslyn | $455,000 | Carol Beal | |
| Borack Roslyn | $455,000 | Carol Beal |
Source: Public Records
Mortgage History
| Date | Status | Borrower | Loan Amount |
|---|---|---|---|
| Previous Owner | Fink Sabina | $603,000 |
Source: Public Records
Tax History
| Year | Tax Paid | Tax Assessment Tax Assessment Total Assessment is a certain percentage of the fair market value that is determined by local assessors to be the total taxable value of land and additions on the property. | Land | Improvement |
|---|---|---|---|---|
| 2024 | $4,995 | $645 | $0 | $645 |
| 2023 | $20,042 | $706 | $0 | $706 |
| 2022 | $20,042 | $760 | $0 | $760 |
| 2021 | $22,307 | $743 | $0 | $743 |
| 2020 | $24,025 | $1,313 | $0 | $1,313 |
| 2019 | $21,590 | $1,313 | $0 | $1,313 |
| 2018 | $21,590 | $1,313 | $0 | $0 |
| 2017 | $14,717 | $1,313 | $0 | $1,313 |
| 2016 | $20,913 | $1,313 | $0 | $1,313 |
| 2015 | $6,523 | $1,588 | $0 | $1,588 |
| 2014 | $6,523 | $1,588 | $0 | $1,588 |
| 2013 | $5,858 | $1,588 | $0 | $1,588 |
Source: Public Records
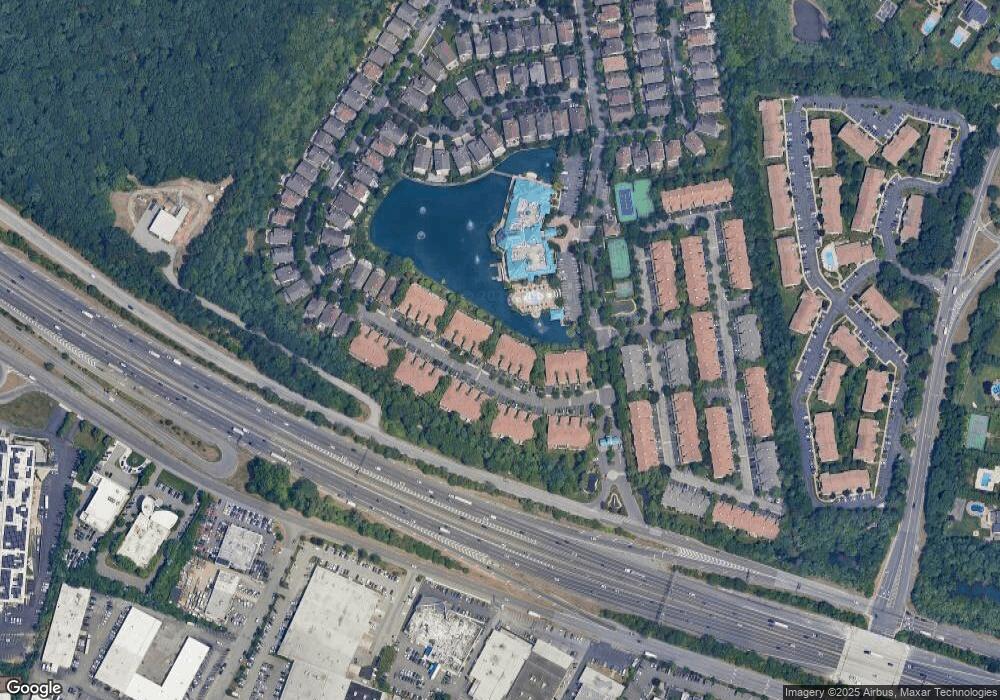
Map
Nearby Homes
- 66 Sagamore Dr
- 202 Carriage Ln
- 2 Old Bridge Ct
- 4 Long Ridge Rd
- 4 Newport Dr
- 9 Princeton Dr
- 25 Cottontail Rd
- 25102 Aspenwood Dr
- 85 Roundtree Dr
- 119 Autumn Dr
- 28301 Spruce Pond Cir
- 61 Hofstra Dr
- 21105 Aspenwood Dr
- 68 Beaumont Dr
- 53 Beaumont Dr
- 26 Estates Cir
- 24 Estates Cir
- 4 Cranford Rd
- 37 Santa Barbara Dr
- 50 Netto Ln
- 33 Sagamore Dr
- 31 Sagamore Dr
- 29 Sagamore Dr
- 27 Sagamore Dr
- 27 Sagamore Dr Unit 115
- 25 Sagamore Dr
- 35 Sagamore Dr
- 37 Sagamore Dr
- 23 Sagamore Dr
- 39 Sagamore Dr
- 21 Sagamore Dr
- 41 Sagamore Dr
- 19 Sagamore Dr
- 43 Sagamore Dr
- 45 Sagamore Dr
- 47 Sagamore Dr
- 49 Sagamore Dr
- 17 Sagamore Dr
- 15 Sagamore Dr
- 36 Sagamore Dr
Your Personal Tour Guide
Ask me questions while you tour the home.