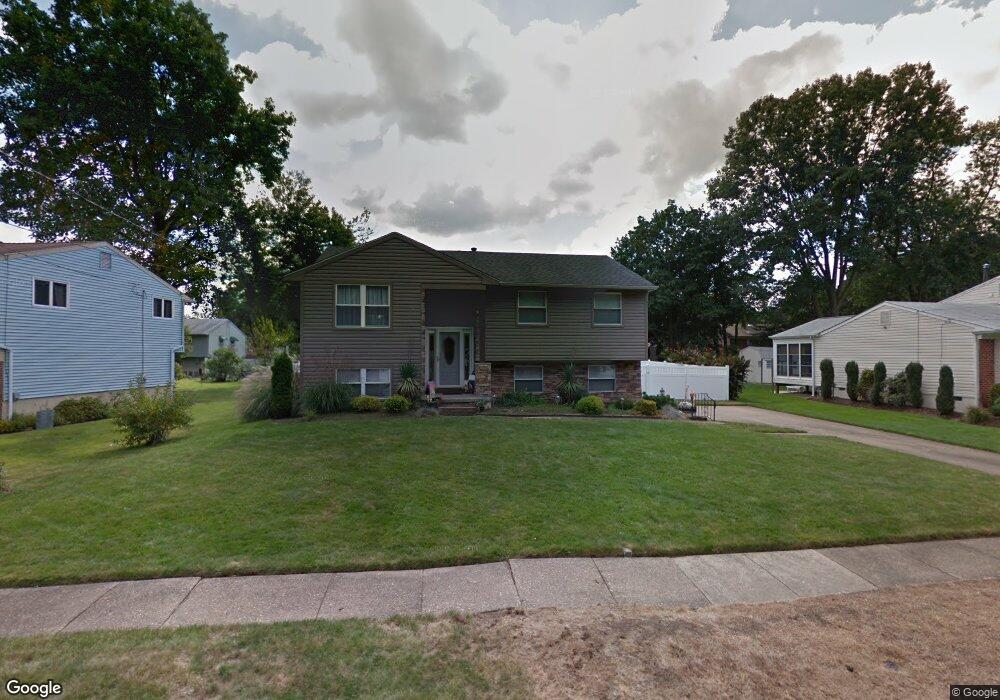
33 Saratoga Rd Stratford, NJ 08084
Estimated Value: $358,321 - $400,000
--
Bed
--
Bath
1,944
Sq Ft
$197/Sq Ft
Est. Value
About This Home
This home is located at 33 Saratoga Rd, Stratford, NJ 08084 and is currently estimated at $382,830, approximately $196 per square foot. 33 Saratoga Rd is a home located in Camden County with nearby schools including Parkview Elementary School, Samuel S. Yellin School, and Sterling High School.
Ownership History
Date
Name
Owned For
Owner Type
Purchase Details
Closed on
Apr 18, 2025
Sold by
Szafranski Ronald
Bought by
Ronald Michael Szafranski And Leslie Ann Szaf and Szafranski
Current Estimated Value
Purchase Details
Closed on
Mar 10, 2017
Sold by
Murphy Anne M and Murphy Michael R
Bought by
Frasca John S
Home Financials for this Owner
Home Financials are based on the most recent Mortgage that was taken out on this home.
Original Mortgage
$133,000
Interest Rate
4.21%
Purchase Details
Closed on
Apr 23, 2004
Sold by
Belzer Robert K
Bought by
Szafranski Ronald
Home Financials for this Owner
Home Financials are based on the most recent Mortgage that was taken out on this home.
Original Mortgage
$169,900
Interest Rate
5.39%
Mortgage Type
Purchase Money Mortgage
Create a Home Valuation Report for This Property
The Home Valuation Report is an in-depth analysis detailing your home's value as well as a comparison with similar homes in the area
Home Values in the Area
Average Home Value in this Area
Purchase History
| Date | Buyer | Sale Price | Title Company |
|---|---|---|---|
| Ronald Michael Szafranski And Leslie Ann Szaf | -- | None Listed On Document | |
| Ronald Michael Szafranski And Leslie Ann Szaf | -- | None Listed On Document | |
| Frasca John S | -- | -- | |
| Szafranski Ronald | $178,900 | -- |
Source: Public Records
Mortgage History
| Date | Status | Borrower | Loan Amount |
|---|---|---|---|
| Previous Owner | Frasca John S | $133,000 | |
| Previous Owner | Frasca John S | -- | |
| Previous Owner | Szafranski Ronald | $169,900 |
Source: Public Records
Tax History Compared to Growth
Tax History
| Year | Tax Paid | Tax Assessment Tax Assessment Total Assessment is a certain percentage of the fair market value that is determined by local assessors to be the total taxable value of land and additions on the property. | Land | Improvement |
|---|---|---|---|---|
| 2025 | $7,901 | $162,800 | $42,300 | $120,500 |
| 2024 | $7,525 | $162,800 | $42,300 | $120,500 |
| 2023 | $7,525 | $162,800 | $42,300 | $120,500 |
| 2022 | $7,585 | $162,800 | $42,300 | $120,500 |
| 2021 | $7,336 | $162,800 | $42,300 | $120,500 |
| 2020 | $7,207 | $162,800 | $42,300 | $120,500 |
| 2019 | $7,202 | $162,800 | $42,300 | $120,500 |
| 2018 | $6,986 | $162,800 | $42,300 | $120,500 |
| 2017 | $6,899 | $162,800 | $42,300 | $120,500 |
| 2016 | $6,688 | $162,800 | $42,300 | $120,500 |
| 2015 | $6,579 | $162,800 | $42,300 | $120,500 |
| 2014 | $6,396 | $162,800 | $42,300 | $120,500 |
Source: Public Records
Map
Nearby Homes