33 Sherburne Ave Unit 4. 33 Tyngsboro, MA 01879
Estimated Value: $349,000 - $376,831
3
Beds
2
Baths
968
Sq Ft
$378/Sq Ft
Est. Value
About This Home
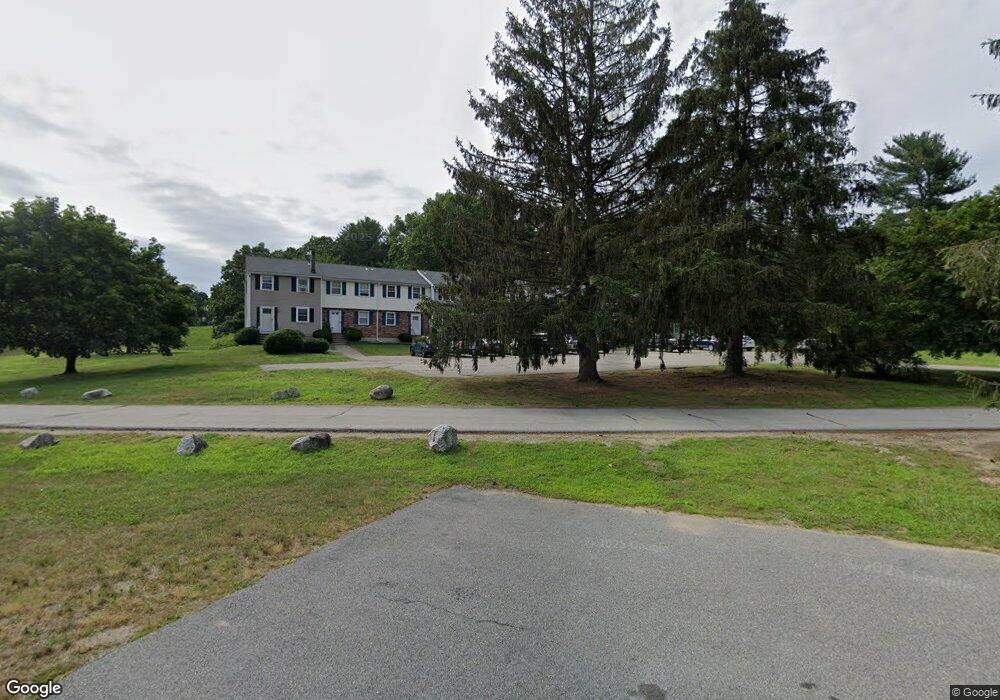
This home is located at 33 Sherburne Ave Unit 4. 33, Tyngsboro, MA 01879 and is currently estimated at $365,958, approximately $378 per square foot. 33 Sherburne Ave Unit 4. 33 is a home located in Middlesex County with nearby schools including Tyngsborough Elementary School, Tyngsborough Middle School, and Tyngsborough High School.
Ownership History
Date
Name
Owned For
Owner Type
Purchase Details
Closed on
Jan 6, 2012
Sold by
Department Of Housing & Urban Dev
Bought by
Stevo Nt
Current Estimated Value
Home Financials for this Owner
Home Financials are based on the most recent Mortgage that was taken out on this home.
Original Mortgage
$72,000
Outstanding Balance
$49,361
Interest Rate
3.98%
Mortgage Type
New Conventional
Estimated Equity
$316,597
Purchase Details
Closed on
Aug 16, 2011
Sold by
Pnc Bank Na
Bought by
Department Of Housing & Urban Dev
Purchase Details
Closed on
Jul 27, 2010
Sold by
Eastman Cynthia A
Bought by
Pnc Bank Na
Purchase Details
Closed on
Feb 3, 2004
Sold by
Connors Margaret N and Connors Noreen E
Bought by
Eastman Cynthia A
Purchase Details
Closed on
Nov 20, 1998
Sold by
Breslin Ann M
Bought by
Connnors Noreen E and Connors Margaret N
Home Financials for this Owner
Home Financials are based on the most recent Mortgage that was taken out on this home.
Original Mortgage
$86,700
Interest Rate
6.49%
Mortgage Type
Purchase Money Mortgage
Create a Home Valuation Report for This Property
The Home Valuation Report is an in-depth analysis detailing your home's value as well as a comparison with similar homes in the area
Home Values in the Area
Average Home Value in this Area
Purchase History
| Date | Buyer | Sale Price | Title Company |
|---|---|---|---|
| Stevo Nt | $75,000 | -- | |
| Department Of Housing & Urban Dev | -- | -- | |
| Pnc Bank Na | $196,609 | -- | |
| Eastman Cynthia A | $185,640 | -- | |
| Connnors Noreen E | $88,500 | -- |
Source: Public Records
Mortgage History
| Date | Status | Borrower | Loan Amount |
|---|---|---|---|
| Open | Connnors Noreen E | $72,000 | |
| Previous Owner | Connnors Noreen E | $86,700 |
Source: Public Records
Tax History Compared to Growth
Tax History
| Year | Tax Paid | Tax Assessment Tax Assessment Total Assessment is a certain percentage of the fair market value that is determined by local assessors to be the total taxable value of land and additions on the property. | Land | Improvement |
|---|---|---|---|---|
| 2025 | $41 | $330,300 | $0 | $330,300 |
| 2024 | $3,984 | $313,200 | $0 | $313,200 |
| 2023 | $4,123 | $291,600 | $0 | $291,600 |
| 2022 | $3,684 | $246,600 | $0 | $246,600 |
| 2021 | $3,209 | $199,700 | $0 | $199,700 |
| 2020 | $3,192 | $196,400 | $0 | $196,400 |
| 2019 | $3,223 | $190,400 | $0 | $190,400 |
| 2018 | $2,842 | $166,100 | $0 | $166,100 |
| 2017 | $2,677 | $156,000 | $0 | $156,000 |
| 2016 | $2,537 | $144,500 | $0 | $144,500 |
| 2015 | $2,451 | $144,500 | $0 | $144,500 |
Source: Public Records
Map
Nearby Homes
- 52 Pawtucket Blvd Unit 21
- 46 Pawtucket Blvd Unit 38
- 46 Pawtucket Blvd Unit 37
- 30 Tamarack Way Unit 30
- 28 Juniper Ln Unit 65
- 11 Juniper Ln Unit 14
- 32 Juniper Ln Unit 61
- 43 Juniper Ln Unit 30
- 26 Juniper Ln Unit 64
- 22 Juniper Ln Unit 66
- 20 Juniper Ln Unit 67
- 17 Juniper Ln Unit 17
- 1 Patricia Dr
- 56 Frost Rd
- 24 Old Tyng Rd
- 75 Frost Rd
- 123 Sherburne Ave
- 111 Sherburne Ave
- 109 Sherburne Ave
- 10 Dickens Ln
- 33 Sherburne Ave Unit 9
- 33 Sherburne Ave Unit 8
- 33 Sherburne Ave Unit 7
- 33 Sherburne Ave Unit 6
- 33 Sherburne Ave Unit 5
- 33 Sherburne Ave Unit 4
- 33 Sherburne Ave Unit 3
- 33 Sherburne Ave Unit 2
- 33 Sherburne Ave Unit 10
- 33 Sherburne Ave Unit 1
- 33 Sherburne Ave Unit 3 33
- 33 Sherburne Ave Unit 6, 33
- 31 Sherburne Ave
- 0 Makos Street Aka 7a Makos Unit 70599896
- 7 Secretariat Way
- Lot 7 Secretariat Way
- 29 Sherburne Ave
- 30 Sherburne Ave
- 30 Sherburne Ave Unit 30
- 52 Pawtucket Blvd Unit 29