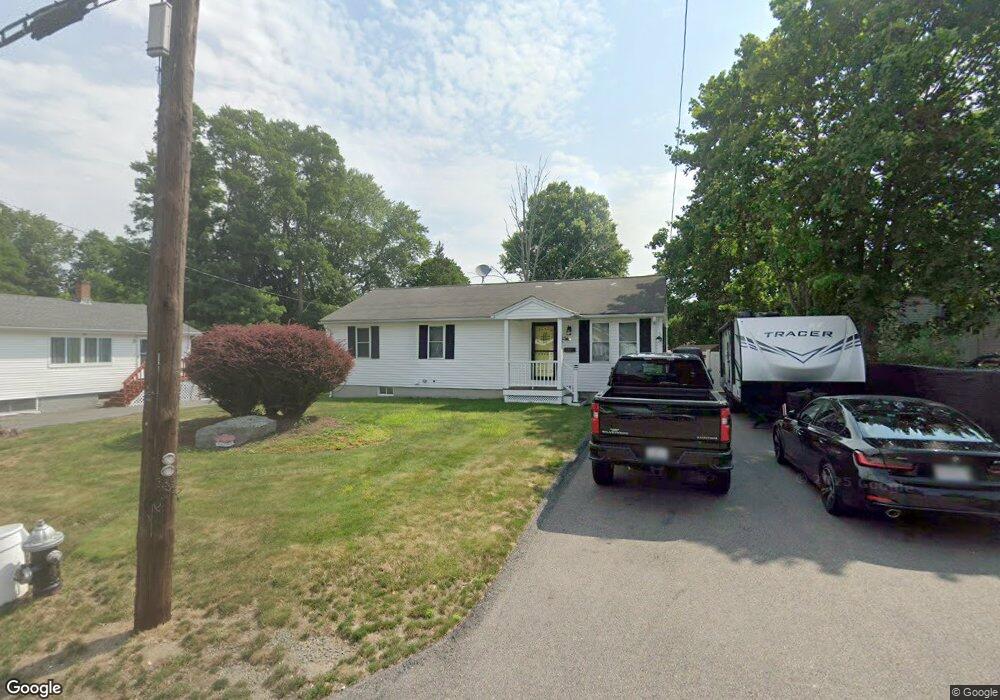
33 Sheridan St Brockton, MA 02302
Estimated Value: $480,000 - $541,000
3
Beds
1
Bath
1,092
Sq Ft
$459/Sq Ft
Est. Value
About This Home
This home is located at 33 Sheridan St, Brockton, MA 02302 and is currently estimated at $501,081, approximately $458 per square foot. 33 Sheridan St is a home located in Plymouth County with nearby schools including Brookfield Elementary School, Downey Elementary School, and Mary E. Baker Elementary School.
Ownership History
Date
Name
Owned For
Owner Type
Purchase Details
Closed on
Apr 6, 2007
Sold by
Brockton Hsng Auth
Bought by
Ramos Thomas J and Duff Susan
Current Estimated Value
Home Financials for this Owner
Home Financials are based on the most recent Mortgage that was taken out on this home.
Original Mortgage
$243,085
Outstanding Balance
$147,782
Interest Rate
6.25%
Mortgage Type
Purchase Money Mortgage
Estimated Equity
$353,299
Purchase Details
Closed on
Jan 10, 2007
Sold by
Clark John K
Bought by
Brockton Hsng Auth
Purchase Details
Closed on
Mar 14, 2005
Sold by
Clark John K
Bought by
Clark John K
Purchase Details
Closed on
Jan 13, 2003
Sold by
Brockton Hsng Auth
Bought by
Clark John K
Home Financials for this Owner
Home Financials are based on the most recent Mortgage that was taken out on this home.
Original Mortgage
$114,492
Interest Rate
6.19%
Mortgage Type
Purchase Money Mortgage
Create a Home Valuation Report for This Property
The Home Valuation Report is an in-depth analysis detailing your home's value as well as a comparison with similar homes in the area
Home Values in the Area
Average Home Value in this Area
Purchase History
| Date | Buyer | Sale Price | Title Company |
|---|---|---|---|
| Ramos Thomas J | $246,900 | -- | |
| Brockton Hsng Auth | $140,000 | -- | |
| Clark John K | -- | -- | |
| Clark John K | $120,000 | -- |
Source: Public Records
Mortgage History
| Date | Status | Borrower | Loan Amount |
|---|---|---|---|
| Open | Clark John K | $243,085 | |
| Previous Owner | Clark John K | $114,492 | |
| Previous Owner | Clark John K | $80,000 |
Source: Public Records
Tax History Compared to Growth
Tax History
| Year | Tax Paid | Tax Assessment Tax Assessment Total Assessment is a certain percentage of the fair market value that is determined by local assessors to be the total taxable value of land and additions on the property. | Land | Improvement |
|---|---|---|---|---|
| 2025 | $5,466 | $451,400 | $145,500 | $305,900 |
| 2024 | $5,322 | $442,800 | $145,500 | $297,300 |
| 2023 | $4,966 | $382,600 | $110,600 | $272,000 |
| 2022 | $4,813 | $344,500 | $100,500 | $244,000 |
| 2021 | $4,456 | $307,300 | $95,300 | $212,000 |
| 2020 | $4,274 | $282,100 | $91,300 | $190,800 |
| 2019 | $4,023 | $258,900 | $85,800 | $173,100 |
| 2018 | $3,813 | $237,400 | $85,800 | $151,600 |
| 2017 | $3,621 | $224,900 | $85,800 | $139,100 |
| 2016 | $3,753 | $216,200 | $81,800 | $134,400 |
| 2015 | $3,390 | $186,800 | $81,800 | $105,000 |
| 2014 | $3,492 | $192,600 | $81,800 | $110,800 |
Source: Public Records
Map
Nearby Homes