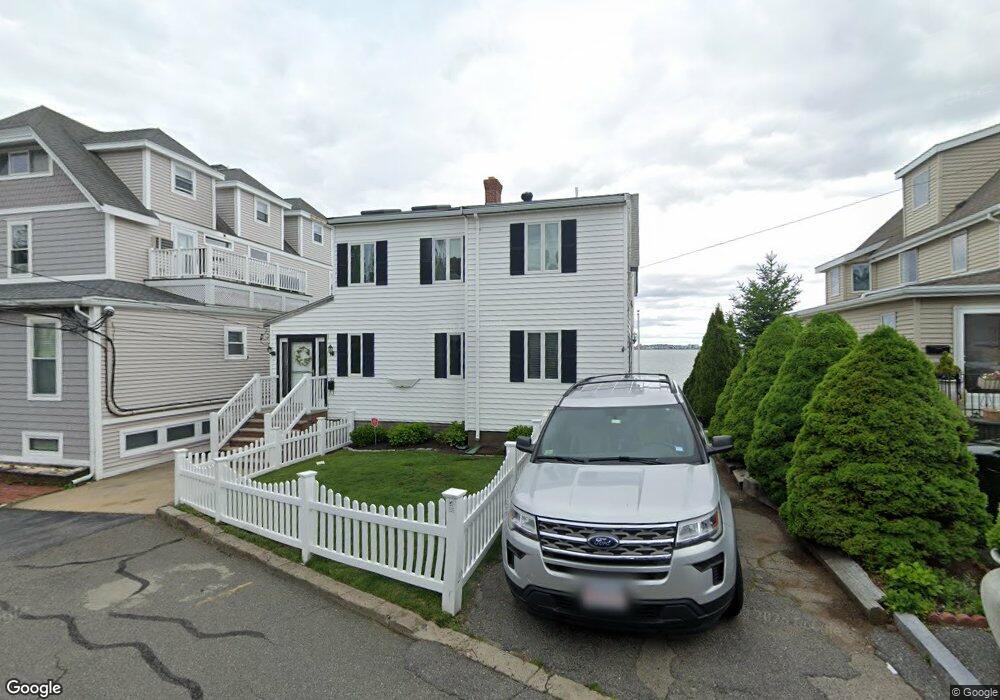
33 Sherman Ave Nahant, MA 01908
Estimated Value: $1,022,000 - $1,232,000
4
Beds
2
Baths
2,547
Sq Ft
$425/Sq Ft
Est. Value
About This Home
This home is located at 33 Sherman Ave, Nahant, MA 01908 and is currently estimated at $1,083,598, approximately $425 per square foot. 33 Sherman Ave is a home located in Essex County with nearby schools including Johnson Elementary School, Swampscott Middle School, and Swampscott High School.
Ownership History
Date
Name
Owned For
Owner Type
Purchase Details
Closed on
Aug 14, 2018
Sold by
Matthews Mary A and Matthews
Bought by
Mary A Matthews Irt 20 and Matthews
Current Estimated Value
Purchase Details
Closed on
Jun 17, 2014
Sold by
Matthews Mary A
Bought by
Mary A Matthews Irt and Matthews
Purchase Details
Closed on
Jul 22, 2013
Sold by
Matthews Michael P
Bought by
Matthews Mary A
Purchase Details
Closed on
Feb 1, 2013
Sold by
Matthews Irt
Bought by
Matthews Michael P
Purchase Details
Closed on
Nov 3, 2010
Sold by
Matthews Daniel R and Matthews Mary A
Bought by
Matthews Irt
Create a Home Valuation Report for This Property
The Home Valuation Report is an in-depth analysis detailing your home's value as well as a comparison with similar homes in the area
Home Values in the Area
Average Home Value in this Area
Purchase History
| Date | Buyer | Sale Price | Title Company |
|---|---|---|---|
| Mary A Matthews Irt 20 | -- | -- | |
| Mary A Matthews Irt 20 | -- | -- | |
| Matthews Mary A | -- | -- | |
| Matthews Michael P | -- | -- | |
| Mary A Matthews Irt 20 | -- | -- | |
| Matthews Mary A | -- | -- | |
| Matthews Michael P | -- | -- | |
| Mary A Matthews Irt | -- | -- | |
| Mary A Matthews Irt | -- | -- | |
| Matthews Mary A | -- | -- | |
| Matthews Mary A | -- | -- | |
| Matthews Michael P | -- | -- | |
| Matthews Mary A | -- | -- | |
| Matthews Mary A | -- | -- | |
| Matthews Irt | -- | -- | |
| Matthews Irt | -- | -- |
Source: Public Records
Mortgage History
| Date | Status | Borrower | Loan Amount |
|---|---|---|---|
| Previous Owner | Matthews Irt | $150,000 |
Source: Public Records
Tax History Compared to Growth
Tax History
| Year | Tax Paid | Tax Assessment Tax Assessment Total Assessment is a certain percentage of the fair market value that is determined by local assessors to be the total taxable value of land and additions on the property. | Land | Improvement |
|---|---|---|---|---|
| 2025 | $7,984 | $872,600 | $468,700 | $403,900 |
| 2024 | $7,914 | $872,600 | $468,700 | $403,900 |
| 2023 | $7,606 | $836,700 | $454,300 | $382,400 |
| 2022 | $7,395 | $755,400 | $411,000 | $344,400 |
| 2021 | $7,341 | $698,500 | $375,000 | $323,500 |
| 2020 | $7,163 | $653,000 | $375,000 | $278,000 |
| 2019 | $6,656 | $610,100 | $360,600 | $249,500 |
| 2018 | $5,825 | $568,300 | $324,500 | $243,800 |
| 2017 | $5,951 | $568,400 | $324,500 | $243,900 |
| 2016 | $5,728 | $544,500 | $310,100 | $234,400 |
| 2015 | $5,706 | $522,500 | $288,100 | $234,400 |
| 2014 | $5,474 | $496,300 | $261,800 | $234,500 |
Source: Public Records
Map
Nearby Homes
- 43 Maple Ave
- 17 Pearl Rd
- 23 Phillips Rd
- 2 Goddard Dr
- 183 Bass Point Rd
- 9 Little Nahant Rd
- 303 Nahant Rd
- 66 Ocean St
- 36 Lennox Rd
- 51 Cliff St
- 3 Cliff St
- 53 Lancaster Ave
- 1 Carey Cir Unit 409
- 16 Blanchard Ave
- 31 Mills Ave
- 474 Revere Beach Blvd Unit 501
- 474 Revere Beach Blvd Unit 903
- 474 Revere Beach Blvd Unit 702
- 474 Revere Beach Blvd Unit 403
- 383 Revere Beach Blvd Unit 5
- 46 Maple Ave
- 93 Sherman Ave
- 93 Sherman Ave Unit 2
- 93 Sherman Ave Unit 7
- 93 Sherman Ave Unit 6
- 93 Sherman Ave Unit 3
- 93 Sherman Ave Unit 1
- 93 Sherman Ave Unit 10
- 93 Sherman Ave Unit 9
- 93 Sherman Ave Unit 8
- 93 Sherman Ave Unit 4
- 93 Sherman Ave Unit 5
- 93 Sherman Ave Unit 9
- 93 Sherman Ave Unit 11
- 93 Sherman Ave
- 40 Maple Ave
- 29 Sherman Ave
- 37 Range Rd
- 41 Maple Ave
- 41 Maple Ave Unit 1