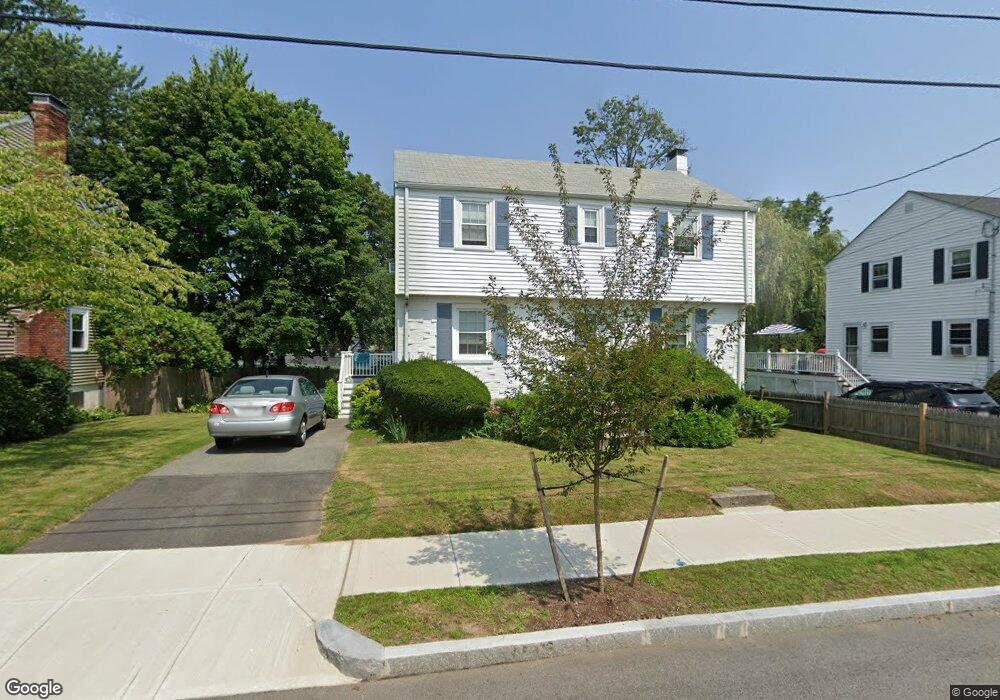
33 Sims Rd Quincy, MA 02170
Wollaston NeighborhoodEstimated Value: $722,000 - $760,000
3
Beds
2
Baths
1,568
Sq Ft
$472/Sq Ft
Est. Value
About This Home
This home is located at 33 Sims Rd, Quincy, MA 02170 and is currently estimated at $740,812, approximately $472 per square foot. 33 Sims Rd is a home located in Norfolk County with nearby schools including Beechwood Knoll Elementary School, Central Middle School, and North Quincy High School.
Ownership History
Date
Name
Owned For
Owner Type
Purchase Details
Closed on
Oct 2, 2020
Sold by
Montgomery Sheila M
Bought by
Sheila Montgomery Ft and Montgomery
Current Estimated Value
Create a Home Valuation Report for This Property
The Home Valuation Report is an in-depth analysis detailing your home's value as well as a comparison with similar homes in the area
Home Values in the Area
Average Home Value in this Area
Purchase History
| Date | Buyer | Sale Price | Title Company |
|---|---|---|---|
| Sheila Montgomery Ft | -- | None Available | |
| Sheila Montgomery Ft | -- | None Available |
Source: Public Records
Tax History
| Year | Tax Paid | Tax Assessment Tax Assessment Total Assessment is a certain percentage of the fair market value that is determined by local assessors to be the total taxable value of land and additions on the property. | Land | Improvement |
|---|---|---|---|---|
| 2025 | $8,072 | $700,100 | $361,900 | $338,200 |
| 2024 | $8,036 | $713,000 | $361,900 | $351,100 |
| 2023 | $7,470 | $671,200 | $344,600 | $326,600 |
| 2022 | $6,977 | $582,400 | $275,700 | $306,700 |
| 2021 | $6,825 | $562,200 | $275,700 | $286,500 |
| 2020 | $6,733 | $541,700 | $275,700 | $266,000 |
| 2019 | $6,275 | $500,000 | $257,700 | $242,300 |
| 2018 | $6,116 | $458,500 | $234,300 | $224,200 |
| 2017 | $6,035 | $425,900 | $234,300 | $191,600 |
| 2016 | $5,628 | $391,900 | $212,900 | $179,000 |
| 2015 | $5,328 | $364,900 | $193,600 | $171,300 |
| 2014 | $5,082 | $342,000 | $184,300 | $157,700 |
Source: Public Records
Map
Nearby Homes
- 10 W Elm Ave
- 11 Cleaves St
- 9 Chick St
- 11 Gould St
- 163 Clay St Unit 3
- 20 Ellington Rd
- 915 Hancock St Unit 2
- 28 Apthorp St
- 10 Weston Ave Unit 322
- 45 Oval Rd Unit 34
- 40 Virginia Rd
- 267-269 Farrington St
- 72 Oakland Ave
- 1025 Hancock St Unit 6J
- 105 Sea St Unit 105
- 105 Sea St Unit 102
- 77 Adams St Unit 610
- 245 Sea St Unit 45
- 98 Safford St
- 28 Edgewood Cir
Your Personal Tour Guide
Ask me questions while you tour the home.