
Seller's Agent in 2021
Kevin Colman
BHHS GROSS AND JANSEN REALTORS
(973) 917-9837
2 in this area
54 Total Sales
Estimated Value: $403,000 - $452,000
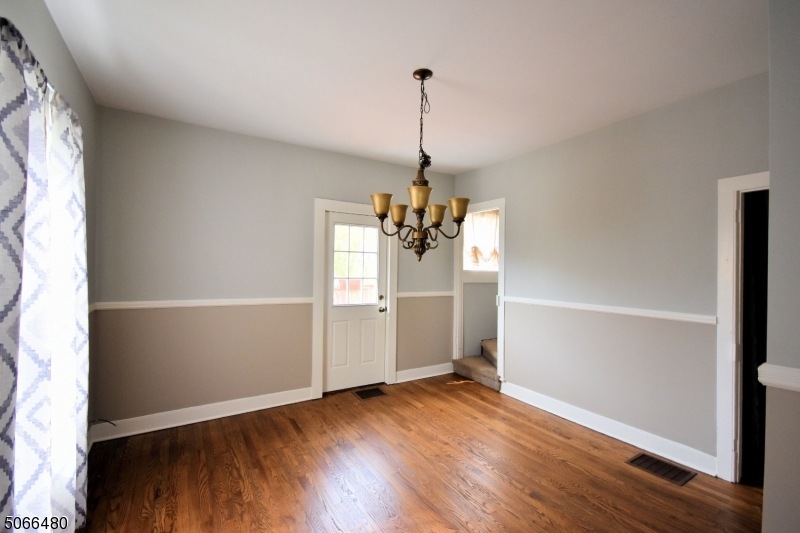
Beautifully maintained updated 4 bedroom Colonial home located on quiet neighborhood street in Historic Franklin, NJ. This property was originally designed as a two family property and converted to a one family home years ago. The expansive 35x15 outdoor deck area completely enhances the first floor living space overlooking the large private back yard area. Most recent upgrades to this home includes replacement windows, beautifully refinished oak floors, upgraded molding accents, New carpeting through out, new roof, gutters, and above ground Roth oil tank. This home is truly move-in condition. Additional downstairs living area makes this home perfect for home office or additional living space use.
| Date | Buyer | Sale Price | Title Company |
|---|---|---|---|
| Obando Miguel A Ramirez | $325,000 | Fidelity National Ttl Ins Co | |
| Obando Miguel A Ramirez | $325,000 | None Listed On Document | |
| Mckinnon Scott A | $125,000 | -- |
| Date | Status | Borrower | Loan Amount |
|---|---|---|---|
| Previous Owner | Obando Miguel A Ramirez | $296,000 | |
| Previous Owner | Obando Miguel A Ramirez | $296,000 |
| Date | Event | Price | List to Sale | Price per Sq Ft |
|---|---|---|---|---|
| 06/23/2021 06/23/21 | Sold | $321,500 | +7.5% | $143 / Sq Ft |
| 05/13/2021 05/13/21 | Pending | -- | -- | -- |
| 04/27/2021 04/27/21 | For Sale | $299,000 | -7.0% | $133 / Sq Ft |
| 04/27/2021 04/27/21 | Off Market | $321,500 | -- | -- |
| Year | Tax Paid | Tax Assessment Tax Assessment Total Assessment is a certain percentage of the fair market value that is determined by local assessors to be the total taxable value of land and additions on the property. | Land | Improvement |
|---|---|---|---|---|
| 2025 | $7,779 | $323,000 | $104,800 | $218,200 |
| 2024 | $7,725 | $293,100 | $83,200 | $209,900 |
| 2023 | $7,725 | $280,200 | $77,100 | $203,100 |
| 2022 | $7,886 | $186,600 | $60,300 | $126,300 |
| 2021 | $7,658 | $186,600 | $60,300 | $126,300 |
| 2020 | $7,417 | $186,600 | $60,300 | $126,300 |
| 2019 | $7,081 | $186,600 | $60,300 | $126,300 |
| 2018 | $6,962 | $186,600 | $60,300 | $126,300 |
| 2017 | $6,792 | $186,600 | $60,300 | $126,300 |
| 2016 | $6,645 | $186,600 | $60,300 | $126,300 |
| 2015 | $6,665 | $186,600 | $60,300 | $126,300 |
| 2014 | $6,496 | $186,600 | $60,300 | $126,300 |
Seller's Agent in 2021
Kevin Colman
BHHS GROSS AND JANSEN REALTORS
(973) 917-9837
2 in this area
54 Total Sales
Buyer's Agent in 2021
Margoth Caballero
WEICHERT REALTORS
(201) 274-6056
2 in this area
13 Total Sales
Source: Garden State MLS
MLS Number: 3707774
APN: 06-00601-0000-00042
Disclaimer: Certain information contained herein is derived from information provided by parties other than Homes.com. All information provided is deemed reliable, but is not guaranteed to be accurate and should be independently verified.
![]() The data relating to real estate for sale on this website comes in part from the IDX Program of Garden State Multiple Listing Service, L.L.C. Real estate listings held by other brokerage firms are marked as IDX Listing.
The data relating to real estate for sale on this website comes in part from the IDX Program of Garden State Multiple Listing Service, L.L.C. Real estate listings held by other brokerage firms are marked as IDX Listing.
Information deemed reliable but not guaranteed.
Copyright © 2025 Garden State Multiple Listing Service, L.L.C. All rights reserved.
Notice: The dissemination of listings on this website does not constitute the consent required by N.J.A.C. 11:5.6.1 (n) for the advertisement of listings exclusively for sale by another broker. Any such consent must be obtained in writing from the listing broker.
This information is being provided for Consumers’ personal, non-commercial use and may not be used for any purpose other than to identify prospective properties Consumers may be interested in purchasing.