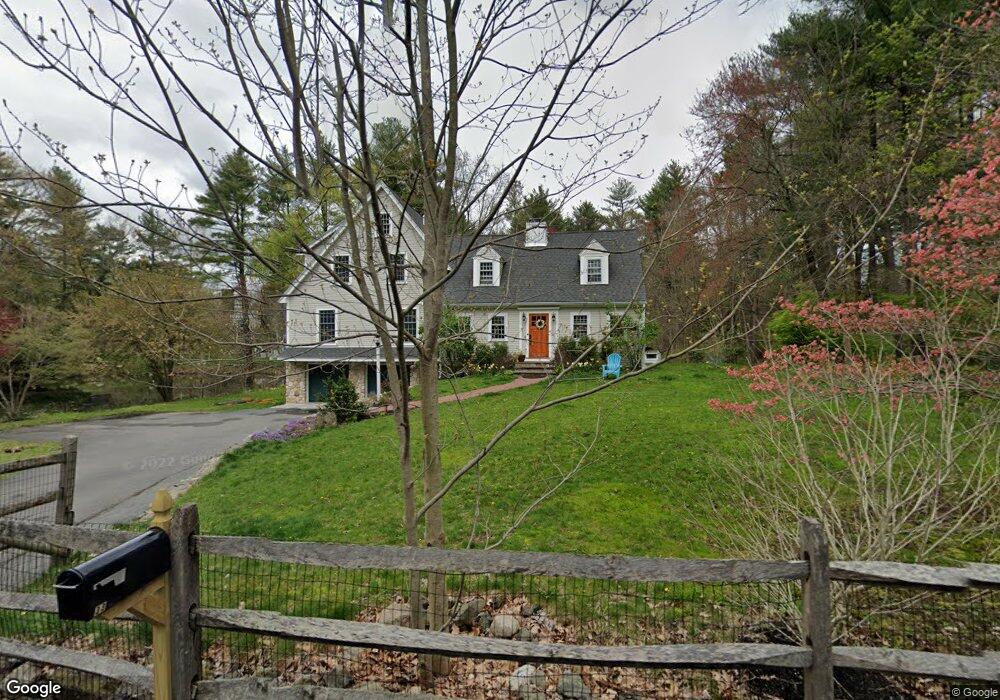
33 Sudbury Rd Weston, MA 02493
Estimated Value: $1,562,000 - $1,777,000
4
Beds
3
Baths
3,034
Sq Ft
$552/Sq Ft
Est. Value
About This Home
This home is located at 33 Sudbury Rd, Weston, MA 02493 and is currently estimated at $1,675,127, approximately $552 per square foot. 33 Sudbury Rd is a home located in Middlesex County with nearby schools including Country Elementary School, Woodland Elementary School, and Field Elementary School.
Ownership History
Date
Name
Owned For
Owner Type
Purchase Details
Closed on
Mar 31, 2004
Sold by
Slavet Mary G A and Aydelott Mary G
Bought by
Jylkka Chris and Eppel Meredith L
Current Estimated Value
Home Financials for this Owner
Home Financials are based on the most recent Mortgage that was taken out on this home.
Original Mortgage
$530,000
Interest Rate
5.56%
Mortgage Type
Purchase Money Mortgage
Purchase Details
Closed on
Aug 28, 1995
Sold by
Smart H Samuel
Bought by
Knowles Julius J and Knowles Christina M
Purchase Details
Closed on
May 31, 1989
Sold by
Traini Anthony
Bought by
Smart H Samuel
Create a Home Valuation Report for This Property
The Home Valuation Report is an in-depth analysis detailing your home's value as well as a comparison with similar homes in the area
Home Values in the Area
Average Home Value in this Area
Purchase History
| Date | Buyer | Sale Price | Title Company |
|---|---|---|---|
| Jylkka Chris | $730,000 | -- | |
| Knowles Julius J | $380,000 | -- | |
| Smart H Samuel | $312,000 | -- |
Source: Public Records
Mortgage History
| Date | Status | Borrower | Loan Amount |
|---|---|---|---|
| Open | Smart H Samuel | $417,000 | |
| Closed | Jylkka Chris | $530,000 | |
| Previous Owner | Smart H Samuel | $375,000 |
Source: Public Records
Tax History
| Year | Tax Paid | Tax Assessment Tax Assessment Total Assessment is a certain percentage of the fair market value that is determined by local assessors to be the total taxable value of land and additions on the property. | Land | Improvement |
|---|---|---|---|---|
| 2025 | $13,428 | $1,209,700 | $816,300 | $393,400 |
| 2024 | $13,185 | $1,185,700 | $816,300 | $369,400 |
| 2023 | $13,248 | $1,118,900 | $816,300 | $302,600 |
| 2022 | $13,298 | $1,038,100 | $777,300 | $260,800 |
| 2021 | $10,048 | $988,100 | $739,500 | $248,600 |
| 2020 | $12,677 | $988,100 | $739,500 | $248,600 |
| 2019 | $11,874 | $943,100 | $739,500 | $203,600 |
| 2018 | $11,798 | $943,100 | $739,500 | $203,600 |
| 2017 | $11,694 | $943,100 | $739,500 | $203,600 |
| 2016 | $11,517 | $947,100 | $739,500 | $207,600 |
| 2015 | $10,185 | $829,400 | $706,500 | $122,900 |
Source: Public Records
Map
Nearby Homes
- 63 Sudbury Rd
- 156 Cherry Brook Rd
- 32 Highland Cir
- 101 Draper Rd
- 4 Peartree Ln
- 46 Blackburnian Rd
- 21 Decatur Ln
- 40 Bakers Hill Rd
- 19 Jericho Rd
- 35 Bemis St
- 93 Old Sudbury Rd
- 6 Clifford Ln
- 741 Boston Post Rd
- 173 Conant Rd
- 30 Warren Ave
- 81 Montvale Rd
- 823 Boston Post Rd
- 127 Glezen Ln
- 291 Concord Rd
- 20 Hickory Hill Rd
Your Personal Tour Guide
Ask me questions while you tour the home.