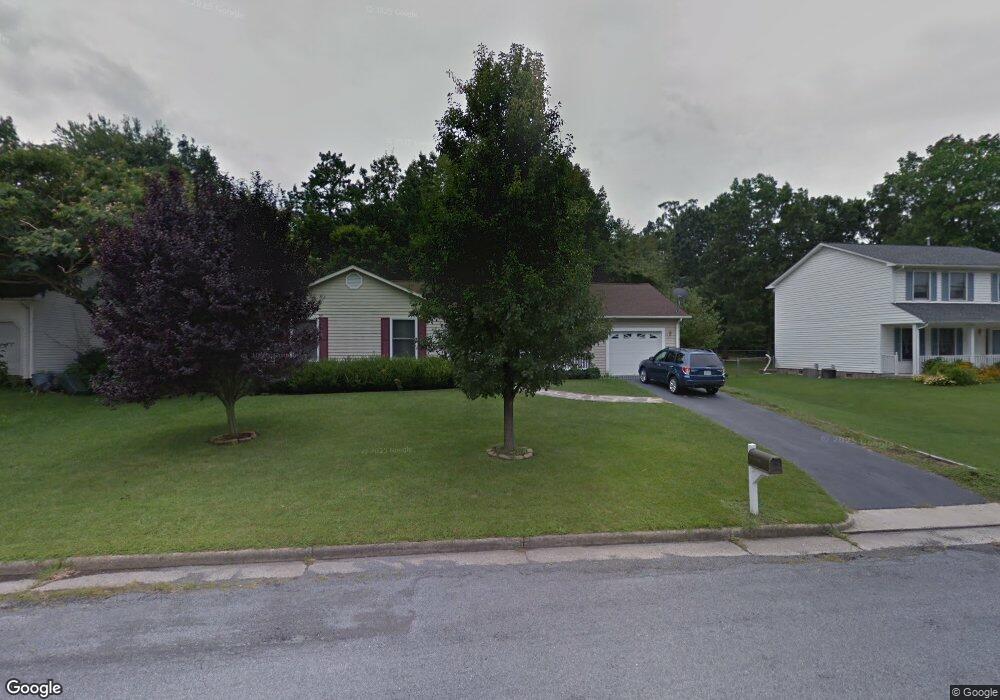
33 Sugarcamp Ln Stuarts Draft, VA 24477
Estimated Value: $312,000 - $381,000
3
Beds
2
Baths
1,564
Sq Ft
$214/Sq Ft
Est. Value
About This Home
This home is located at 33 Sugarcamp Ln, Stuarts Draft, VA 24477 and is currently estimated at $334,026, approximately $213 per square foot. 33 Sugarcamp Ln is a home located in Augusta County with nearby schools including Guy K. Stump Elementary School, Stuarts Draft Middle School, and Stuarts Draft High School.
Ownership History
Date
Name
Owned For
Owner Type
Purchase Details
Closed on
Jun 6, 2012
Sold by
Wood Joseph Dean and Wood Holly G
Bought by
Rosenthal Michael S and Rosenthal Theresa J
Current Estimated Value
Home Financials for this Owner
Home Financials are based on the most recent Mortgage that was taken out on this home.
Original Mortgage
$168,614
Outstanding Balance
$115,407
Interest Rate
3.87%
Mortgage Type
FHA
Estimated Equity
$218,619
Purchase Details
Closed on
Apr 4, 2005
Sold by
Davis Phillip E and Davis Deborah J
Bought by
Wood Joseph Dean and Moyer Holly G
Home Financials for this Owner
Home Financials are based on the most recent Mortgage that was taken out on this home.
Original Mortgage
$137,800
Interest Rate
5.7%
Mortgage Type
Credit Line Revolving
Create a Home Valuation Report for This Property
The Home Valuation Report is an in-depth analysis detailing your home's value as well as a comparison with similar homes in the area
Purchase History
| Date | Buyer | Sale Price | Title Company |
|---|---|---|---|
| Rosenthal Michael S | $173,000 | Insight Settlement Services | |
| Wood Joseph Dean | -- | -- |
Source: Public Records
Mortgage History
| Date | Status | Borrower | Loan Amount |
|---|---|---|---|
| Open | Rosenthal Michael S | $168,614 | |
| Previous Owner | Wood Joseph Dean | $137,800 |
Source: Public Records
Tax History
| Year | Tax Paid | Tax Assessment Tax Assessment Total Assessment is a certain percentage of the fair market value that is determined by local assessors to be the total taxable value of land and additions on the property. | Land | Improvement |
|---|---|---|---|---|
| 2025 | $1,500 | $288,400 | $60,000 | $228,400 |
| 2024 | $1,521 | $292,500 | $60,000 | $232,500 |
| 2023 | $1,210 | $192,000 | $40,000 | $152,000 |
| 2022 | $1,210 | $192,000 | $40,000 | $152,000 |
| 2021 | $1,210 | $192,000 | $40,000 | $152,000 |
| 2020 | $1,210 | $192,000 | $40,000 | $152,000 |
| 2019 | $1,210 | $192,000 | $40,000 | $152,000 |
| 2018 | $1,097 | $174,243 | $40,000 | $134,243 |
| 2017 | $1,010 | $174,243 | $40,000 | $134,243 |
| 2016 | $1,010 | $174,243 | $40,000 | $134,243 |
| 2015 | $898 | $174,243 | $40,000 | $134,243 |
| 2014 | $898 | $174,243 | $40,000 | $134,243 |
| 2013 | $898 | $187,100 | $55,000 | $132,100 |
Source: Public Records
Map
Nearby Homes
- 294 Forest Springs Dr
- 251 Cooper Dr
- 253 Forest Springs Dr
- 77 Greenway Rd
- 87 Falling Rock Dr
- 165 Cooper Dr
- 124 Forest Springs Dr
- 12 Ceocia Ln
- 501 Howardsville Turnpike
- 38 Greenbriar Ln
- TBD Howardsville Turnpike
- TBD Churchmans Mill Rd
- TBD Gerties Ln
- 0 Kiley Ln Unit 569156
- tbd Mill Creek Ln
- TBD Cold Springs Rd
- 114 Jaspers Ln
- 241 Bowmans Run Dr
- 0 Johnson Dr Unit 663189
- 153 Sylvan Dr
- 27 Sugarcamp Ln
- 41 Sugarcamp Ln
- 21 Sugarcamp Ln
- 34 Sugarcamp Ln
- 53 Sugarcamp Ln
- 52 Sugarcamp Ln
- 11 Sugarcamp Ln
- 299 Falling Rock Dr
- 300 Falling Rock Dr
- 61 Sugarcamp Ln
- 394 Cooper Dr
- 3 Sugarcamp Ln
- 293 Falling Rock Dr
- 62 Sugarcamp Ln
- 386 Cooper Dr
- 292 Falling Rock Dr
- 69 Sugarcamp Ln
- 380 Cooper Dr
- 285 Falling Rock Dr
- 4 Springer Rd
Your Personal Tour Guide
Ask me questions while you tour the home.