Estimated Value: $140,000 - $277,000
3
Beds
2
Baths
1,430
Sq Ft
$149/Sq Ft
Est. Value
About This Home
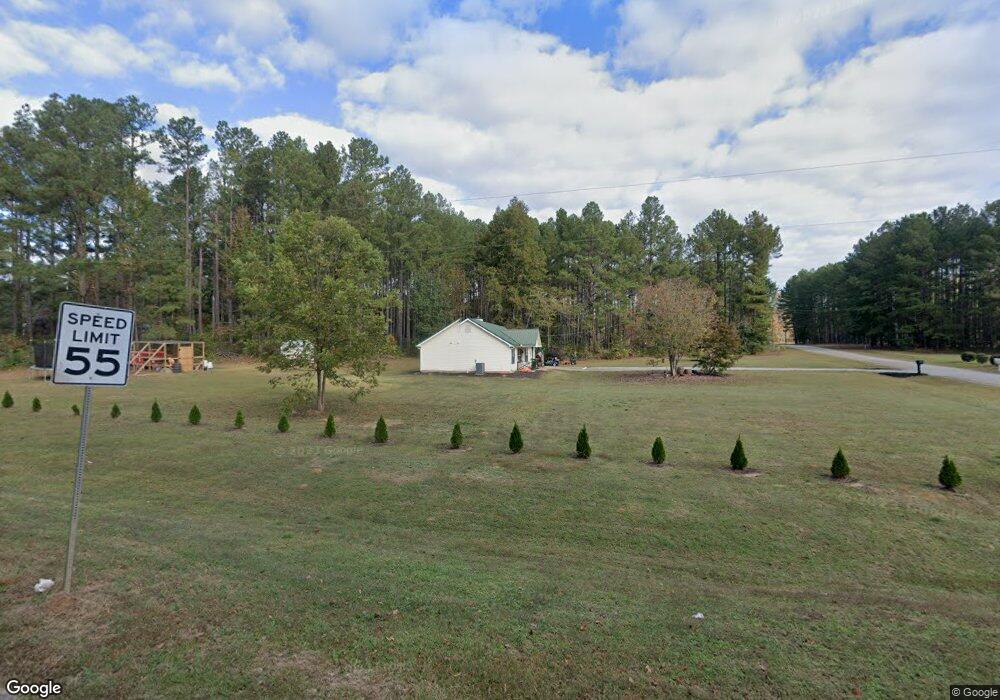
This home is located at 33 Summer Dr, Gay, GA 30218 and is currently estimated at $213,653, approximately $149 per square foot. 33 Summer Dr is a home located in Meriwether County with nearby schools including Unity Elementary School.
Ownership History
Date
Name
Owned For
Owner Type
Purchase Details
Closed on
Jul 14, 2017
Sold by
Byrom Charles M
Bought by
Morris Brazen Colt
Current Estimated Value
Home Financials for this Owner
Home Financials are based on the most recent Mortgage that was taken out on this home.
Original Mortgage
$88,205
Outstanding Balance
$73,324
Interest Rate
3.91%
Mortgage Type
New Conventional
Estimated Equity
$140,329
Purchase Details
Closed on
Oct 30, 2007
Sold by
Yager Scott M
Bought by
Byrom Charles M
Home Financials for this Owner
Home Financials are based on the most recent Mortgage that was taken out on this home.
Original Mortgage
$30,000
Interest Rate
6.26%
Mortgage Type
New Conventional
Purchase Details
Closed on
Jul 9, 2003
Sold by
Schuchmann Christian
Bought by
Yager Scott M and Yager Jeanette L
Purchase Details
Closed on
Feb 3, 2000
Sold by
C & R Homes
Bought by
Schuchmann Christian
Purchase Details
Closed on
Jan 8, 1999
Sold by
Green Aubrey and Green Inez
Bought by
C & R Homes
Create a Home Valuation Report for This Property
The Home Valuation Report is an in-depth analysis detailing your home's value as well as a comparison with similar homes in the area
Home Values in the Area
Average Home Value in this Area
Purchase History
| Date | Buyer | Sale Price | Title Company |
|---|---|---|---|
| Morris Brazen Colt | $91,000 | -- | |
| Byrom Charles M | $101,250 | -- | |
| Yager Scott M | $83,000 | -- | |
| Schuchmann Christian | $78,900 | -- | |
| C & R Homes | $85,000 | -- |
Source: Public Records
Mortgage History
| Date | Status | Borrower | Loan Amount |
|---|---|---|---|
| Open | Morris Brazen Colt | $88,205 | |
| Previous Owner | Byrom Charles M | $30,000 |
Source: Public Records
Tax History Compared to Growth
Tax History
| Year | Tax Paid | Tax Assessment Tax Assessment Total Assessment is a certain percentage of the fair market value that is determined by local assessors to be the total taxable value of land and additions on the property. | Land | Improvement |
|---|---|---|---|---|
| 2024 | $2,119 | $63,796 | $7,200 | $56,596 |
| 2023 | $1,955 | $56,636 | $7,200 | $49,436 |
| 2022 | $1,379 | $39,956 | $7,200 | $32,756 |
| 2021 | $1,401 | $39,956 | $7,200 | $32,756 |
| 2020 | $1,412 | $39,956 | $7,200 | $32,756 |
| 2019 | $1,416 | $39,956 | $7,200 | $32,756 |
| 2018 | $1,302 | $39,956 | $7,200 | $32,756 |
| 2017 | $1,157 | $39,956 | $7,200 | $32,756 |
| 2016 | $1,040 | $39,956 | $7,200 | $32,756 |
| 2015 | $1,040 | $39,956 | $7,200 | $32,756 |
| 2014 | $1,038 | $39,956 | $7,200 | $32,756 |
| 2013 | -- | $39,956 | $7,200 | $32,756 |
Source: Public Records
Map
Nearby Homes
- 10580 Callaway Rd
- 294 Ike Williams Rd
- 333 Ike Williams Rd
- 277 Griffin Hwy
- 64 Timberland Ct
- The Bradford Plan at Garner Woods
- The Northern Hills Plan at Garner Woods
- The Forsythe Plan at Garner Woods
- 795 Alexander Rd
- 210 Hidden Meadows Dr
- 181 Hidden Meadows Dr
- 123 Hidden Meadows Dr
- 156 Hidden Meadows Dr
- 21743 Highway 85
- 3255 Alvaton Rd
- 21101 Georgia 85
- 20911 Georgia 85
- 59 Red Ln
- 759 Alvaton Rd
- 50 AC Mount Carmel Rd
- 83 Summer Dr
- 30 Summer Dr
- 10855 Callaway Rd
- 10898 Callaway Rd
- 10872 Callaway Rd
- 84 Summer Dr
- 209 Summer Dr
- 10934 Callaway Rd
- 0 Ga 85 & 362 Hwy Unit 20020761
- 34 Crickett Ct
- 241 Summer Dr
- 0 Cricket Ct Unit 7139253
- 0 Summer Dr Unit 7537153
- 10775 Callaway Rd
- 10786 Callaway Rd
- 210 Summer Dr
- 33 Crickett Ct
- 45 Jamestown Rd
- 240 Summer Dr
- 48 Crickett Ct