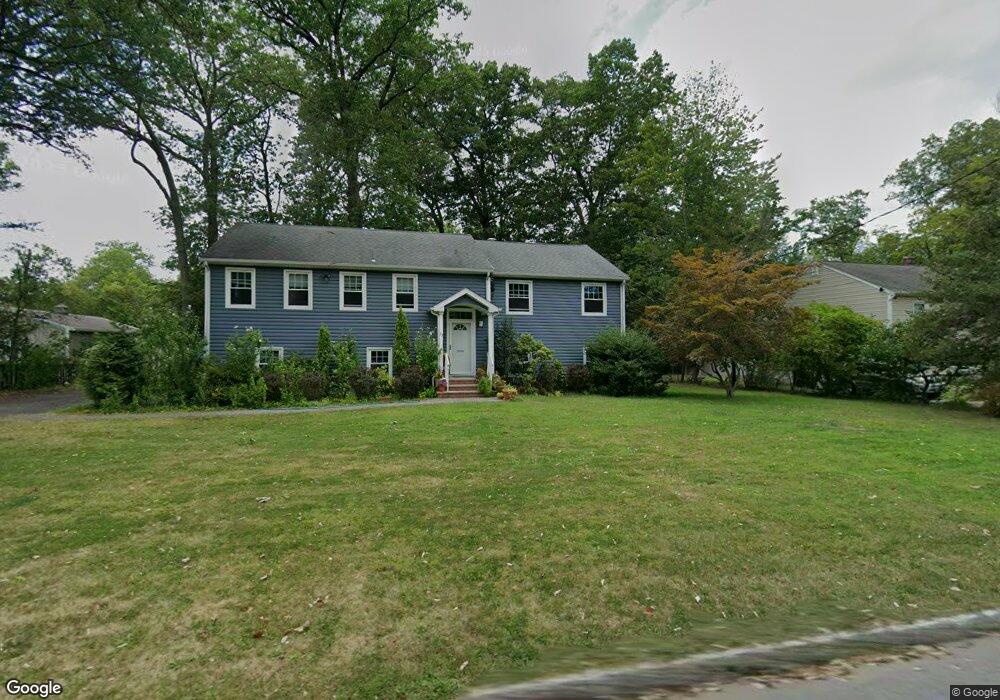
33 Swan Rd Livingston, NJ 07039
Estimated Value: $1,025,000 - $1,204,000
--
Bed
--
Bath
2,138
Sq Ft
$533/Sq Ft
Est. Value
About This Home
This home is located at 33 Swan Rd, Livingston, NJ 07039 and is currently estimated at $1,138,782, approximately $532 per square foot. 33 Swan Rd is a home located in Essex County with nearby schools including Livingston Sr High School and Aquinas Academy.
Ownership History
Date
Name
Owned For
Owner Type
Purchase Details
Closed on
Mar 27, 2025
Sold by
Speiser Alan and Speiser Elaine
Bought by
Elaine Speiser Income Only Trust
Current Estimated Value
Purchase Details
Closed on
Oct 22, 2010
Sold by
Speiser Harry and Speiser Edythe
Bought by
The Speiser Income Only Trust
Purchase Details
Closed on
Apr 6, 2006
Sold by
Hong Myung Soo
Bought by
Speiser Harry and Speiser Edythe
Purchase Details
Closed on
Jul 26, 1999
Sold by
Kormylo Anna
Bought by
Hong Myung
Home Financials for this Owner
Home Financials are based on the most recent Mortgage that was taken out on this home.
Original Mortgage
$236,000
Interest Rate
7.54%
Create a Home Valuation Report for This Property
The Home Valuation Report is an in-depth analysis detailing your home's value as well as a comparison with similar homes in the area
Home Values in the Area
Average Home Value in this Area
Purchase History
| Date | Buyer | Sale Price | Title Company |
|---|---|---|---|
| Elaine Speiser Income Only Trust | -- | None Listed On Document | |
| The Speiser Income Only Trust | -- | None Available | |
| Speiser Harry | $600,000 | -- | |
| Hong Myung | $295,100 | -- |
Source: Public Records
Mortgage History
| Date | Status | Borrower | Loan Amount |
|---|---|---|---|
| Previous Owner | Hong Myung | $236,000 |
Source: Public Records
Tax History Compared to Growth
Tax History
| Year | Tax Paid | Tax Assessment Tax Assessment Total Assessment is a certain percentage of the fair market value that is determined by local assessors to be the total taxable value of land and additions on the property. | Land | Improvement |
|---|---|---|---|---|
| 2025 | $11,293 | $476,100 | $270,000 | $206,100 |
| 2024 | $11,293 | $476,100 | $270,000 | $206,100 |
| 2022 | $11,107 | $476,100 | $270,000 | $206,100 |
| 2021 | $11,017 | $476,100 | $270,000 | $206,100 |
| 2020 | $10,812 | $476,100 | $270,000 | $206,100 |
| 2019 | $11,636 | $444,800 | $265,000 | $179,800 |
| 2018 | $11,480 | $444,800 | $265,000 | $179,800 |
| 2017 | $11,329 | $444,800 | $265,000 | $179,800 |
| 2016 | $11,120 | $444,800 | $265,000 | $179,800 |
| 2015 | $10,955 | $444,800 | $265,000 | $179,800 |
| 2014 | $10,600 | $444,800 | $265,000 | $179,800 |
Source: Public Records
Map
Nearby Homes