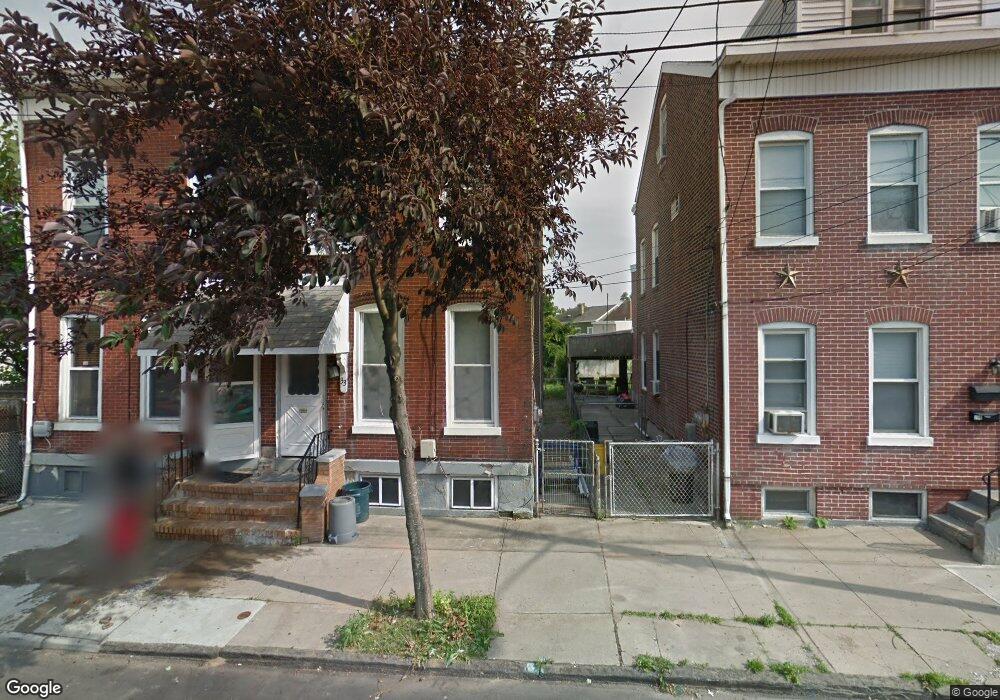
33 Swan St Trenton, NJ 08611
Chambersburg NeighborhoodEstimated Value: $189,366 - $283,000
4
Beds
1
Bath
1,464
Sq Ft
$158/Sq Ft
Est. Value
About This Home
This home is located at 33 Swan St, Trenton, NJ 08611 and is currently estimated at $231,842, approximately $158 per square foot. 33 Swan St is a home located in Mercer County with nearby schools including Robbins Elementary School, Monument Elementary School, and Grace A Dunn Middle School.
Ownership History
Date
Name
Owned For
Owner Type
Purchase Details
Closed on
Jun 1, 2009
Sold by
Filipponi Kathleen Ann
Bought by
Marden Khaled and Marden Bolor E
Current Estimated Value
Home Financials for this Owner
Home Financials are based on the most recent Mortgage that was taken out on this home.
Original Mortgage
$86,400
Outstanding Balance
$54,853
Interest Rate
4.86%
Mortgage Type
Purchase Money Mortgage
Estimated Equity
$176,989
Create a Home Valuation Report for This Property
The Home Valuation Report is an in-depth analysis detailing your home's value as well as a comparison with similar homes in the area
Home Values in the Area
Average Home Value in this Area
Purchase History
| Date | Buyer | Sale Price | Title Company |
|---|---|---|---|
| Marden Khaled | $108,000 | -- | |
| Marden Khaled | $108,000 | Insignia Title & Abstract |
Source: Public Records
Mortgage History
| Date | Status | Borrower | Loan Amount |
|---|---|---|---|
| Open | Marden Khaled | $86,400 |
Source: Public Records
Tax History Compared to Growth
Tax History
| Year | Tax Paid | Tax Assessment Tax Assessment Total Assessment is a certain percentage of the fair market value that is determined by local assessors to be the total taxable value of land and additions on the property. | Land | Improvement |
|---|---|---|---|---|
| 2025 | $3,452 | $59,500 | $9,100 | $50,400 |
| 2024 | $3,312 | $59,500 | $9,100 | $50,400 |
| 2023 | $3,312 | $59,500 | $9,100 | $50,400 |
| 2022 | $3,248 | $59,500 | $9,100 | $50,400 |
| 2021 | $3,304 | $59,500 | $9,100 | $50,400 |
| 2020 | $3,293 | $59,500 | $9,100 | $50,400 |
| 2019 | $3,240 | $59,500 | $9,100 | $50,400 |
| 2018 | $3,102 | $59,500 | $9,100 | $50,400 |
| 2017 | $2,948 | $59,500 | $9,100 | $50,400 |
| 2016 | $3,647 | $63,400 | $18,100 | $45,300 |
| 2015 | $3,635 | $63,400 | $18,100 | $45,300 |
| 2014 | $3,618 | $63,400 | $18,100 | $45,300 |
Source: Public Records
Map
Nearby Homes