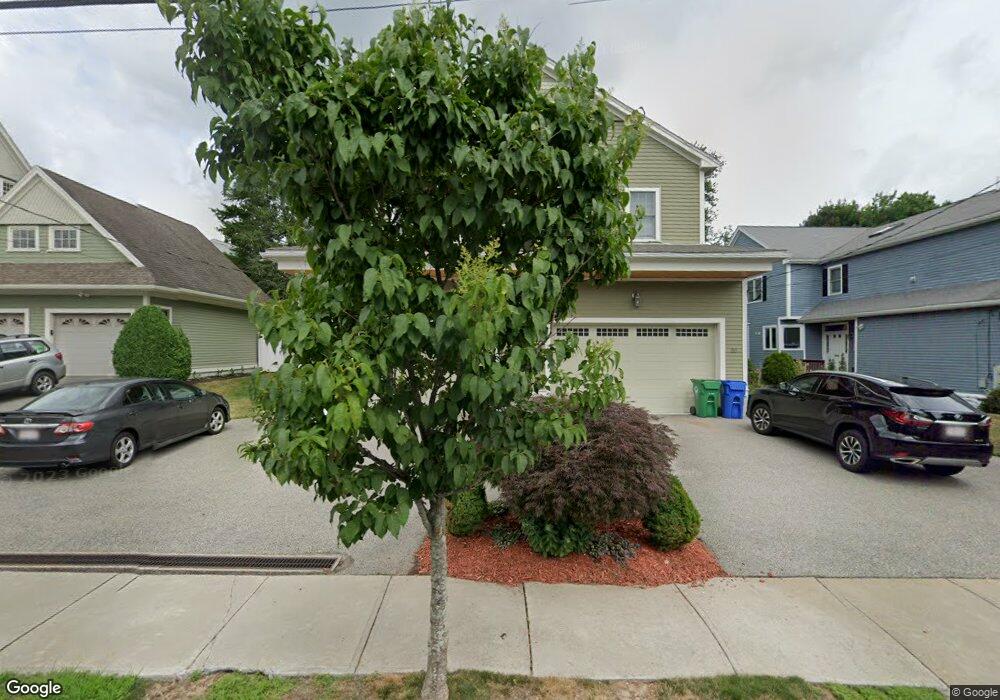
33 Tanglewood Rd Unit 1 Newton, MA 02459
Thompsonville NeighborhoodEstimated Value: $1,389,000 - $1,735,000
3
Beds
3
Baths
3,600
Sq Ft
$427/Sq Ft
Est. Value
About This Home
This home is located at 33 Tanglewood Rd Unit 1, Newton, MA 02459 and is currently estimated at $1,538,350, approximately $427 per square foot. 33 Tanglewood Rd Unit 1 is a home located in Middlesex County with nearby schools including Bowen School, Memorial Spaulding Elementary School, and Oak Hill Middle School.
Ownership History
Date
Name
Owned For
Owner Type
Purchase Details
Closed on
Dec 6, 2022
Sold by
Gani Patricia
Bought by
Patricia Gani Ret
Current Estimated Value
Purchase Details
Closed on
Dec 12, 2018
Sold by
Lee Brenda C and Lee Yee K
Bought by
Brenda Chi C & Y K Lee Irt
Purchase Details
Closed on
Jul 28, 2011
Sold by
Jds Dev Llc
Bought by
Gani Patricia
Home Financials for this Owner
Home Financials are based on the most recent Mortgage that was taken out on this home.
Original Mortgage
$275,000
Interest Rate
4.52%
Mortgage Type
Purchase Money Mortgage
Purchase Details
Closed on
Dec 18, 2009
Sold by
Wiljad-Nicsha Llc
Bought by
Jds Dev Llc
Purchase Details
Closed on
Jul 16, 2008
Sold by
Ching-Lee Brenda Chi and Lee Yee Koon
Bought by
Wiljad Nicsha Llc
Create a Home Valuation Report for This Property
The Home Valuation Report is an in-depth analysis detailing your home's value as well as a comparison with similar homes in the area
Home Values in the Area
Average Home Value in this Area
Purchase History
| Date | Buyer | Sale Price | Title Company |
|---|---|---|---|
| Patricia Gani Ret | -- | None Available | |
| Patricia Gani Ret | -- | None Available | |
| Brenda Chi C & Y K Lee Irt | -- | -- | |
| Brenda Chi C & Y K Lee Irt | -- | -- | |
| Gani Patricia | $812,000 | -- | |
| Gani Patricia | $812,000 | -- | |
| Jds Dev Llc | -- | -- | |
| Jds Dev Llc | -- | -- | |
| Wiljad Nicsha Llc | -- | -- | |
| Wiljad Nicsha Llc | -- | -- |
Source: Public Records
Mortgage History
| Date | Status | Borrower | Loan Amount |
|---|---|---|---|
| Previous Owner | Gani Patricia | $275,000 |
Source: Public Records
Tax History Compared to Growth
Tax History
| Year | Tax Paid | Tax Assessment Tax Assessment Total Assessment is a certain percentage of the fair market value that is determined by local assessors to be the total taxable value of land and additions on the property. | Land | Improvement |
|---|---|---|---|---|
| 2025 | $12,498 | $1,275,300 | $0 | $1,275,300 |
| 2024 | $12,085 | $1,238,200 | $0 | $1,238,200 |
| 2023 | $11,883 | $1,167,300 | $0 | $1,167,300 |
| 2022 | $11,695 | $1,111,700 | $0 | $1,111,700 |
| 2021 | $11,285 | $1,048,800 | $0 | $1,048,800 |
| 2020 | $10,949 | $1,048,800 | $0 | $1,048,800 |
| 2019 | $10,641 | $1,018,300 | $0 | $1,018,300 |
| 2018 | $10,659 | $985,100 | $0 | $985,100 |
| 2017 | $10,334 | $929,300 | $0 | $929,300 |
| 2016 | $9,884 | $868,500 | $0 | $868,500 |
| 2015 | $9,603 | $827,100 | $0 | $827,100 |
Source: Public Records
Map
Nearby Homes
- 38 Tanglewood Rd
- 79 Florence St Unit 600S
- 79 Florence St Unit 402S
- 136 Dudley Rd
- 41-43 John Unit B
- 280 Boylston St Unit 203
- 280 Boylston St Unit 905
- 280 Boylston St Unit 710
- 280 Boylston St Unit 908
- 280 Boylston St Unit 415
- 280 Boylston St Unit 511
- 85 Dudley Rd
- 250 Hammond Pond Pkwy Unit 1604N
- 250 Hammond Pond Pkwy Unit 1002N
- 250 Hammond Pond Pkwy Unit 614S
- 250 Hammond Pond Pkwy Unit 603S
- 250 Hammond Pond Pkwy Unit 615N
- 250 Hammond Pond Pkwy Unit 306N
- 80 Louise Rd Unit 82
- 20 Hamlet St
- 29 Tanglewood Rd
- 67 Tanglewood Rd
- 27 Tanglewood Rd Unit 27
- 27 Tanglewood Rd
- 27 Tanglewood Rd Unit 2 27
- 27 Tanglewood Rd
- 27 Tanglewood Rd Unit 1
- 69 Tanglewood Rd
- 61 Tanglewood Rd
- 63 Tanglewood Rd
- 25 Tanglewood Rd
- 23 Tanglewood Rd
- 340 Boylston St Unit C
- 340 Boylston St Unit B
- 340 Boylston St Unit A
- 338 Boylston St Unit 338C
- 338 C Boylston St Unit 338C
- 34 Tanglewood Rd
- 34 Tanglewood Rd Unit 2 34
- 19 Tanglewood Rd