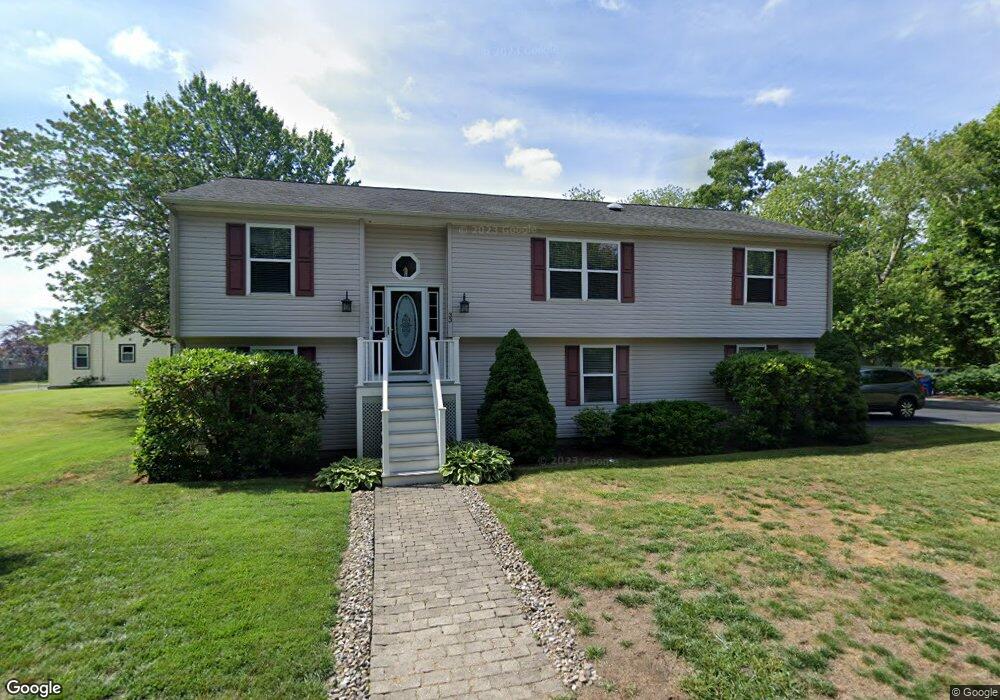
33 Thompson St Fairhaven, MA 02719
Estimated Value: $522,000 - $744,000
3
Beds
2
Baths
1,505
Sq Ft
$403/Sq Ft
Est. Value
About This Home
This home is located at 33 Thompson St, Fairhaven, MA 02719 and is currently estimated at $606,973, approximately $403 per square foot. 33 Thompson St is a home located in Bristol County with nearby schools including Fairhaven High School, City On A Hill Charter Public School New Bedford, and St. Joseph School.
Ownership History
Date
Name
Owned For
Owner Type
Purchase Details
Closed on
Aug 7, 2003
Sold by
Hardy Kathleen M and Hardy Steven W
Bought by
Hardy Ft and Hardy Kathleen M
Current Estimated Value
Purchase Details
Closed on
May 2, 2001
Sold by
Tassopoulos Evangelos and Tassopoulos Catherine
Bought by
Hardy Steven W and Hardy Kathleen M
Purchase Details
Closed on
Jul 6, 2000
Sold by
Burgess Nancy J
Bought by
Tassopoulos Evangelos and Tassopoulos Catherine
Create a Home Valuation Report for This Property
The Home Valuation Report is an in-depth analysis detailing your home's value as well as a comparison with similar homes in the area
Home Values in the Area
Average Home Value in this Area
Purchase History
| Date | Buyer | Sale Price | Title Company |
|---|---|---|---|
| Hardy Ft | -- | -- | |
| Hardy Steven W | $78,750 | -- | |
| Tassopoulos Evangelos | $50,000 | -- | |
| Burgess Nancy J | $39,000 | -- |
Source: Public Records
Mortgage History
| Date | Status | Borrower | Loan Amount |
|---|---|---|---|
| Open | Burgess Nancy J | $52,500 |
Source: Public Records
Tax History Compared to Growth
Tax History
| Year | Tax Paid | Tax Assessment Tax Assessment Total Assessment is a certain percentage of the fair market value that is determined by local assessors to be the total taxable value of land and additions on the property. | Land | Improvement |
|---|---|---|---|---|
| 2025 | $41 | $434,800 | $173,600 | $261,200 |
| 2024 | $3,949 | $427,800 | $173,600 | $254,200 |
| 2023 | $3,788 | $380,700 | $152,000 | $228,700 |
| 2022 | $3,742 | $366,100 | $141,300 | $224,800 |
| 2021 | $3,814 | $337,800 | $127,800 | $210,000 |
| 2020 | $3,736 | $337,800 | $127,800 | $210,000 |
| 2019 | $3,572 | $306,100 | $106,000 | $200,100 |
| 2018 | $3,539 | $290,100 | $100,900 | $189,200 |
| 2017 | $3,453 | $286,800 | $100,900 | $185,900 |
| 2016 | $3,293 | $270,400 | $100,900 | $169,500 |
| 2015 | $3,243 | $266,900 | $100,900 | $166,000 |
Source: Public Records
Map
Nearby Homes