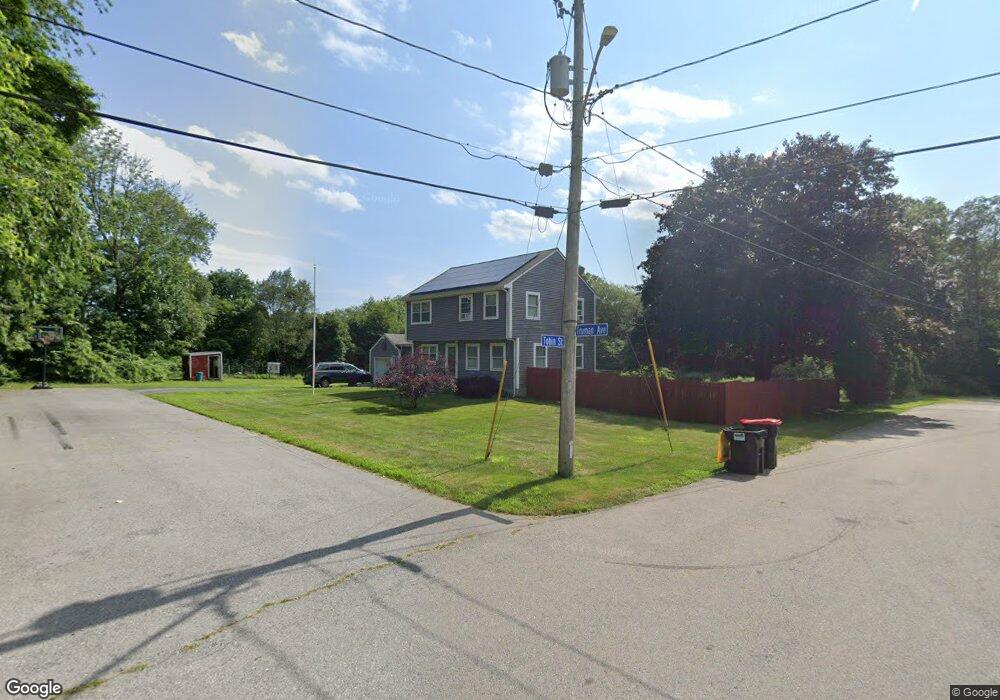
33 Truman St Westport, MA 02790
North Westport NeighborhoodEstimated Value: $478,000 - $611,000
4
Beds
--
Bath
1,821
Sq Ft
$297/Sq Ft
Est. Value
About This Home
This home is located at 33 Truman St, Westport, MA 02790 and is currently estimated at $541,723, approximately $297 per square foot. 33 Truman St is a home located in Bristol County with nearby schools including Alice A. Macomber Primary School, Westport Elementary School, and Westport Middle-High School.
Ownership History
Date
Name
Owned For
Owner Type
Purchase Details
Closed on
Mar 9, 2007
Sold by
Butler Linda M and Butler Robert W
Bought by
Conroy Christopher M and Conroy Wendy A
Current Estimated Value
Home Financials for this Owner
Home Financials are based on the most recent Mortgage that was taken out on this home.
Original Mortgage
$170,000
Interest Rate
6.3%
Mortgage Type
Purchase Money Mortgage
Purchase Details
Closed on
May 9, 2006
Sold by
Butler Ft and Butler Linda M
Bought by
Butler Linda M and Butler Robert W
Create a Home Valuation Report for This Property
The Home Valuation Report is an in-depth analysis detailing your home's value as well as a comparison with similar homes in the area
Home Values in the Area
Average Home Value in this Area
Purchase History
| Date | Buyer | Sale Price | Title Company |
|---|---|---|---|
| Conroy Christopher M | $240,000 | -- | |
| Butler Linda M | -- | -- |
Source: Public Records
Mortgage History
| Date | Status | Borrower | Loan Amount |
|---|---|---|---|
| Open | Butler Linda M | $165,000 | |
| Closed | Butler Linda M | $170,000 |
Source: Public Records
Tax History Compared to Growth
Tax History
| Year | Tax Paid | Tax Assessment Tax Assessment Total Assessment is a certain percentage of the fair market value that is determined by local assessors to be the total taxable value of land and additions on the property. | Land | Improvement |
|---|---|---|---|---|
| 2025 | $3,379 | $453,500 | $159,600 | $293,900 |
| 2024 | $3,371 | $436,100 | $147,900 | $288,200 |
| 2023 | $3,321 | $407,000 | $134,700 | $272,300 |
| 2022 | $2,961 | $349,200 | $122,500 | $226,700 |
| 2021 | $2,914 | $338,100 | $111,400 | $226,700 |
| 2020 | $2,812 | $333,600 | $106,900 | $226,700 |
| 2019 | $2,675 | $323,400 | $106,900 | $216,500 |
| 2018 | $2,350 | $287,600 | $108,100 | $179,500 |
| 2017 | $2,264 | $284,100 | $104,600 | $179,500 |
| 2016 | $2,220 | $280,700 | $101,200 | $179,500 |
| 2015 | $2,168 | $273,400 | $103,500 | $169,900 |
Source: Public Records
Map
Nearby Homes