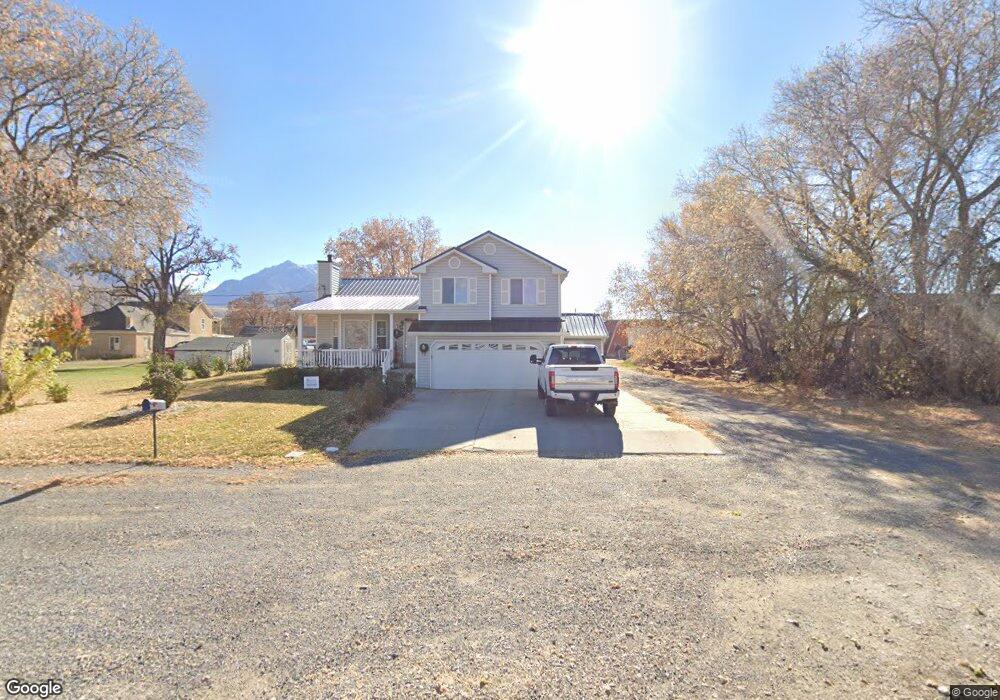
33 W 100 N Santaquin, UT 84655
Estimated Value: $511,000
3
Beds
2
Baths
1,953
Sq Ft
$262/Sq Ft
Est. Value
About This Home
This home is located at 33 W 100 N, Santaquin, UT 84655 and is currently estimated at $511,000, approximately $261 per square foot. 33 W 100 N is a home with nearby schools including Apple Valley Elementary, Payson Junior High School, and Payson High School.
Ownership History
Date
Name
Owned For
Owner Type
Purchase Details
Closed on
Feb 27, 2024
Sold by
Fred Hc Openshaw and Fred Patricia Openshaw
Bought by
Fred And Carlotte Openshaw Living Trust and Openshaw
Current Estimated Value
Purchase Details
Closed on
May 18, 2022
Sold by
Openshaw Fred C
Bought by
Openshaw Fred C and Openshaw Carlotte D
Purchase Details
Closed on
Dec 4, 2012
Sold by
Openshaw Fred
Bought by
Openshaw Fred C and Openshaw Carlotte D
Home Financials for this Owner
Home Financials are based on the most recent Mortgage that was taken out on this home.
Original Mortgage
$177,000
Interest Rate
3.36%
Mortgage Type
New Conventional
Create a Home Valuation Report for This Property
The Home Valuation Report is an in-depth analysis detailing your home's value as well as a comparison with similar homes in the area
Home Values in the Area
Average Home Value in this Area
Purchase History
Date | Buyer | Sale Price | Title Company |
---|---|---|---|
Fred And Carlotte Openshaw Living Trust | -- | None Listed On Document | |
Fred Hc Openshaw And Patricia Openshaw Family | -- | None Listed On Document | |
Openshaw Fred C | -- | Morgan Law Pllc | |
Openshaw Fred C | -- | Absolute Title Agency | |
Openshaw Fred | -- | Absolute Title Agency |
Source: Public Records
Mortgage History
Date | Status | Borrower | Loan Amount |
---|---|---|---|
Open | Fred | $226,000 | |
Previous Owner | Openshaw Fred C | $177,000 | |
Previous Owner | Openshaw Fred C | $184,000 |
Source: Public Records
Tax History Compared to Growth
Tax History
Year | Tax Paid | Tax Assessment Tax Assessment Total Assessment is a certain percentage of the fair market value that is determined by local assessors to be the total taxable value of land and additions on the property. | Land | Improvement |
---|---|---|---|---|
2024 | $2,260 | $225,005 | $0 | $0 |
2023 | $2,395 | $239,305 | $0 | $0 |
2022 | $2,439 | $251,295 | $0 | $0 |
2021 | $2,115 | $337,800 | $76,700 | $261,100 |
2020 | $2,030 | $314,200 | $66,700 | $247,500 |
2019 | $1,782 | $282,000 | $63,000 | $219,000 |
2018 | $1,586 | $239,300 | $59,300 | $180,000 |
2017 | $1,519 | $122,485 | $0 | $0 |
2016 | $1,446 | $114,290 | $0 | $0 |
2015 | $1,314 | $101,805 | $0 | $0 |
2014 | $1,179 | $91,190 | $0 | $0 |
Source: Public Records
Map
Nearby Homes