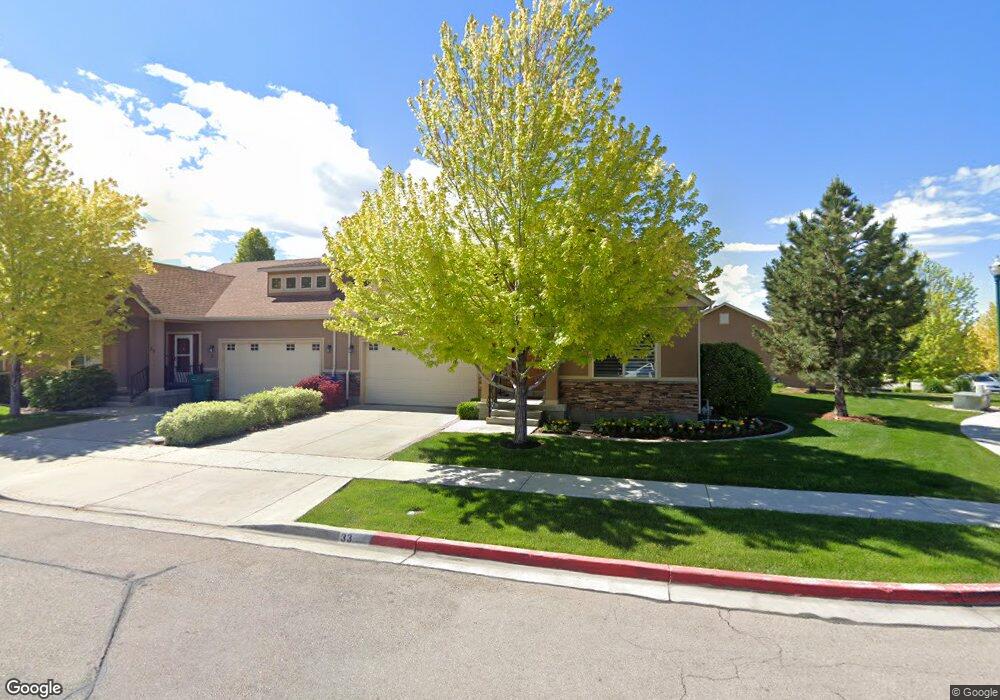
33 W 720 S Orem, UT 84058
Orem South NeighborhoodEstimated Value: $452,000 - $530,000
2
Beds
2
Baths
3,107
Sq Ft
$161/Sq Ft
Est. Value
About This Home
This home is located at 33 W 720 S, Orem, UT 84058 and is currently estimated at $500,274, approximately $161 per square foot. 33 W 720 S is a home located in Utah County with nearby schools including Westmore Elementary School, Lakeridge Jr High School, and Mountain View High School.
Ownership History
Date
Name
Owned For
Owner Type
Purchase Details
Closed on
Feb 24, 2016
Sold by
Young Craig J and Young Shanon M
Bought by
Young Craig J and Young Shanon M
Current Estimated Value
Purchase Details
Closed on
Jul 14, 2014
Sold by
Savage Sherrie
Bought by
Young Craig J and Young Shanon M
Home Financials for this Owner
Home Financials are based on the most recent Mortgage that was taken out on this home.
Original Mortgage
$208,800
Outstanding Balance
$158,505
Interest Rate
4.07%
Mortgage Type
New Conventional
Estimated Equity
$341,769
Create a Home Valuation Report for This Property
The Home Valuation Report is an in-depth analysis detailing your home's value as well as a comparison with similar homes in the area
Home Values in the Area
Average Home Value in this Area
Purchase History
| Date | Buyer | Sale Price | Title Company |
|---|---|---|---|
| Young Craig J | -- | None Available | |
| Young Craig J | -- | First American Title Co Llc |
Source: Public Records
Mortgage History
| Date | Status | Borrower | Loan Amount |
|---|---|---|---|
| Open | Young Craig J | $208,800 |
Source: Public Records
Tax History Compared to Growth
Tax History
| Year | Tax Paid | Tax Assessment Tax Assessment Total Assessment is a certain percentage of the fair market value that is determined by local assessors to be the total taxable value of land and additions on the property. | Land | Improvement |
|---|---|---|---|---|
| 2025 | $2,315 | $291,060 | $106,400 | $422,800 |
| 2024 | $2,315 | $283,085 | $0 | $0 |
| 2023 | $2,210 | $290,455 | $0 | $0 |
| 2022 | $2,165 | $275,605 | $0 | $0 |
| 2021 | $1,968 | $379,600 | $90,000 | $289,600 |
| 2020 | $1,855 | $351,500 | $90,000 | $261,500 |
| 2019 | $1,619 | $319,000 | $90,000 | $229,000 |
| 2018 | $1,577 | $296,900 | $90,000 | $206,900 |
| 2017 | $1,428 | $144,045 | $0 | $0 |
| 2016 | $1,548 | $144,045 | $0 | $0 |
| 2015 | $1,575 | $138,600 | $0 | $0 |
| 2014 | $1,438 | $125,950 | $0 | $0 |
Source: Public Records
Map
Nearby Homes