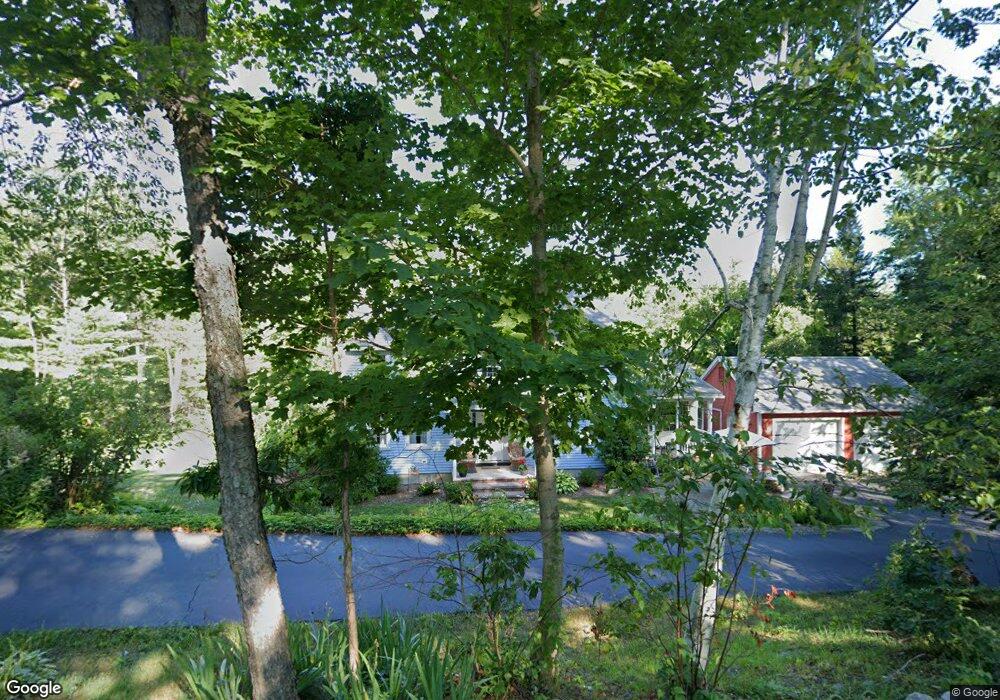
33 Webber Rd West Whately, MA 01039
Estimated Value: $355,000 - $531,000
4
Beds
2
Baths
2,356
Sq Ft
$191/Sq Ft
Est. Value
About This Home
This home is located at 33 Webber Rd, West Whately, MA 01039 and is currently estimated at $450,722, approximately $191 per square foot. 33 Webber Rd is a home with nearby schools including Whately Elementary School and Frontier Regional School.
Ownership History
Date
Name
Owned For
Owner Type
Purchase Details
Closed on
Mar 30, 2022
Sold by
Boyer Brian R and Boyer Esther
Bought by
Boyer Mark B and Clark Abby J
Current Estimated Value
Purchase Details
Closed on
Jul 9, 1981
Bought by
Boyer Brian R and Boyer Esther
Create a Home Valuation Report for This Property
The Home Valuation Report is an in-depth analysis detailing your home's value as well as a comparison with similar homes in the area
Home Values in the Area
Average Home Value in this Area
Purchase History
| Date | Buyer | Sale Price | Title Company |
|---|---|---|---|
| Boyer Mark B | -- | None Available | |
| Boyer Brian R | -- | -- |
Source: Public Records
Mortgage History
| Date | Status | Borrower | Loan Amount |
|---|---|---|---|
| Previous Owner | Boyer Brian R | $35,000 | |
| Previous Owner | Boyer Brian R | $13,432 | |
| Previous Owner | Boyer Brian R | $16,500 |
Source: Public Records
Tax History
| Year | Tax Paid | Tax Assessment Tax Assessment Total Assessment is a certain percentage of the fair market value that is determined by local assessors to be the total taxable value of land and additions on the property. | Land | Improvement |
|---|---|---|---|---|
| 2025 | $4,705 | $352,700 | $95,100 | $257,600 |
| 2024 | $4,807 | $351,100 | $99,800 | $251,300 |
| 2023 | $4,635 | $326,400 | $95,100 | $231,300 |
| 2022 | $4,475 | $326,400 | $95,100 | $231,300 |
| 2021 | $4,434 | $297,200 | $95,100 | $202,100 |
| 2020 | $4,529 | $289,000 | $92,400 | $196,600 |
| 2019 | $4,485 | $289,000 | $92,400 | $196,600 |
| 2018 | $4,433 | $289,000 | $92,400 | $196,600 |
| 2017 | $4,508 | $289,000 | $92,400 | $196,600 |
| 2016 | $4,256 | $284,500 | $92,400 | $192,100 |
| 2015 | $4,411 | $272,800 | $80,700 | $192,100 |
| 2014 | $4,302 | $272,800 | $80,700 | $192,100 |
Source: Public Records
Map
Nearby Homes
- 92 Masterson Rd
- 0 North St Unit 73407299
- 79 State Rd
- 134 Nash Hill Rd
- 0 Old Stage Rd Unit 73494659
- 37 N Farms Rd
- 86 Ashfield Rd
- 59 N Hatfield Rd
- 151 Ashfield Rd
- 3 Kingsley Ave
- 158 Main St
- 0 Straits Rd
- 149 Prospect St
- 0 Greenfield Rd Unit 73472322
- 90 Whately Rd
- 71 Chestnut St
- 901 Roaring Brook Rd
- 26 S Main St
- 24 Elm St
- 14 Sugarloaf St
Your Personal Tour Guide
Ask me questions while you tour the home.