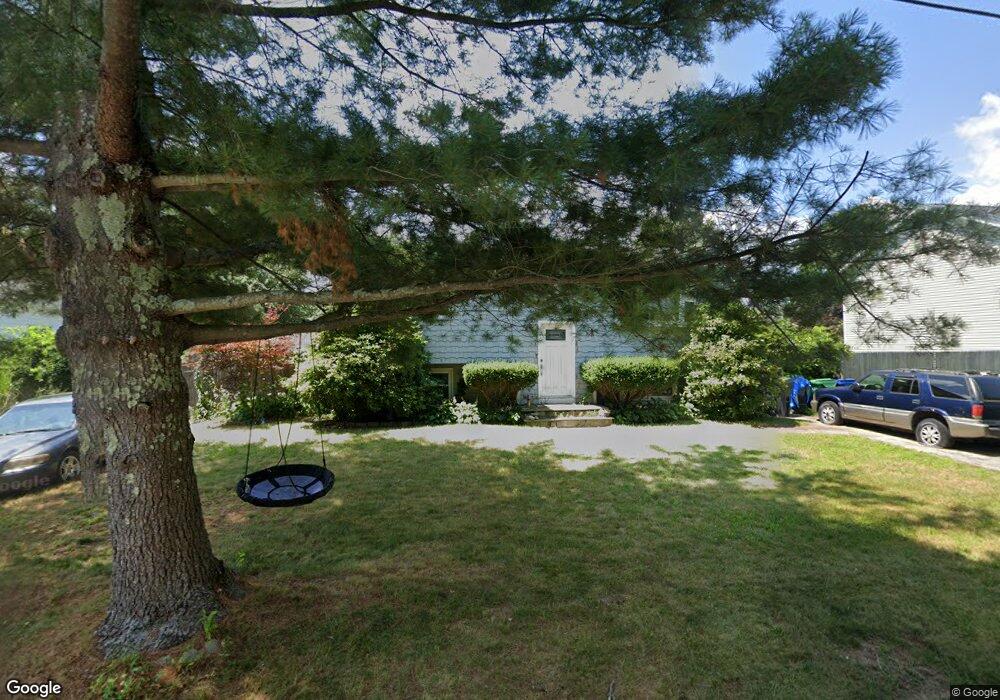
33 Webster St Warwick, RI 02889
Oakland Beach NeighborhoodEstimated Value: $329,000 - $385,079
2
Beds
1
Bath
1,466
Sq Ft
$248/Sq Ft
Est. Value
About This Home
This home is located at 33 Webster St, Warwick, RI 02889 and is currently estimated at $363,520, approximately $247 per square foot. 33 Webster St is a home located in Kent County with nearby schools including Saint Kevin School and Bishop Hendricken High School.
Ownership History
Date
Name
Owned For
Owner Type
Purchase Details
Closed on
Jan 14, 2016
Sold by
Izzo Neal
Bought by
Lunsford Amy B
Current Estimated Value
Home Financials for this Owner
Home Financials are based on the most recent Mortgage that was taken out on this home.
Original Mortgage
$132,275
Outstanding Balance
$104,954
Interest Rate
3.97%
Mortgage Type
New Conventional
Estimated Equity
$258,566
Purchase Details
Closed on
Jan 19, 2011
Sold by
Department Of Housing & Urban Dev
Bought by
Izzo Neal A
Home Financials for this Owner
Home Financials are based on the most recent Mortgage that was taken out on this home.
Original Mortgage
$87,000
Interest Rate
4.62%
Mortgage Type
Purchase Money Mortgage
Purchase Details
Closed on
Jul 13, 2010
Sold by
Wells Fargo Bk
Bought by
Department Of Housing & Urban Dev
Purchase Details
Closed on
Apr 7, 2010
Sold by
Leite Mario and Wells Fargo Bk
Bought by
Wells Fargo Bk
Purchase Details
Closed on
Jul 1, 2005
Sold by
Difilippo Pasquale J and Difilippo Maria A
Bought by
Leite Mario and Leite Maria
Home Financials for this Owner
Home Financials are based on the most recent Mortgage that was taken out on this home.
Original Mortgage
$231,270
Interest Rate
5.73%
Mortgage Type
Purchase Money Mortgage
Create a Home Valuation Report for This Property
The Home Valuation Report is an in-depth analysis detailing your home's value as well as a comparison with similar homes in the area
Home Values in the Area
Average Home Value in this Area
Purchase History
| Date | Buyer | Sale Price | Title Company |
|---|---|---|---|
| Lunsford Amy B | $145,000 | -- | |
| Izzo Neal A | $117,000 | -- | |
| Department Of Housing & Urban Dev | -- | -- | |
| Wells Fargo Bk | $240,112 | -- | |
| Leite Mario | $235,000 | -- |
Source: Public Records
Mortgage History
| Date | Status | Borrower | Loan Amount |
|---|---|---|---|
| Open | Leite Mario | $132,275 | |
| Previous Owner | Leite Mario | $87,000 | |
| Previous Owner | Leite Mario | $231,270 |
Source: Public Records
Tax History
| Year | Tax Paid | Tax Assessment Tax Assessment Total Assessment is a certain percentage of the fair market value that is determined by local assessors to be the total taxable value of land and additions on the property. | Land | Improvement |
|---|---|---|---|---|
| 2025 | $4,103 | $323,100 | $101,200 | $221,900 |
| 2024 | $3,852 | $266,200 | $83,600 | $182,600 |
| 2023 | $3,777 | $266,200 | $83,600 | $182,600 |
| 2022 | $3,482 | $185,900 | $47,000 | $138,900 |
| 2021 | $3,482 | $185,900 | $47,000 | $138,900 |
| 2020 | $3,482 | $185,900 | $47,000 | $138,900 |
| 2019 | $3,482 | $185,900 | $47,000 | $138,900 |
| 2018 | $2,993 | $143,900 | $47,000 | $96,900 |
| 2017 | $2,913 | $143,900 | $47,000 | $96,900 |
| 2016 | $2,913 | $143,900 | $47,000 | $96,900 |
| 2015 | $3,025 | $145,800 | $58,000 | $87,800 |
| 2014 | $2,925 | $145,800 | $58,000 | $87,800 |
| 2013 | $2,885 | $145,800 | $58,000 | $87,800 |
Source: Public Records
Map
Nearby Homes
- 195 Oakland Beach Ave
- 31 Oakhurst Ave
- 15 Center Ct
- 73 Pinehurst Ave
- 71 Pinehurst Ave
- 79 Pinehurst Ave
- 81 Pinehurst Ave
- 9 Kenneth Ave
- 75 Northup St
- 266 Vineyard Rd
- 107 Coburn St
- 585 Meadow View Ave
- 188 Wood St
- 176 Canfield Ave
- 357 Pequot Ave
- 43 Beaver Ave
- 165 Canfield Ave
- 83 Ottawa Ave
- 52 Uncas St
- 0 Sea View Dr
Your Personal Tour Guide
Ask me questions while you tour the home.