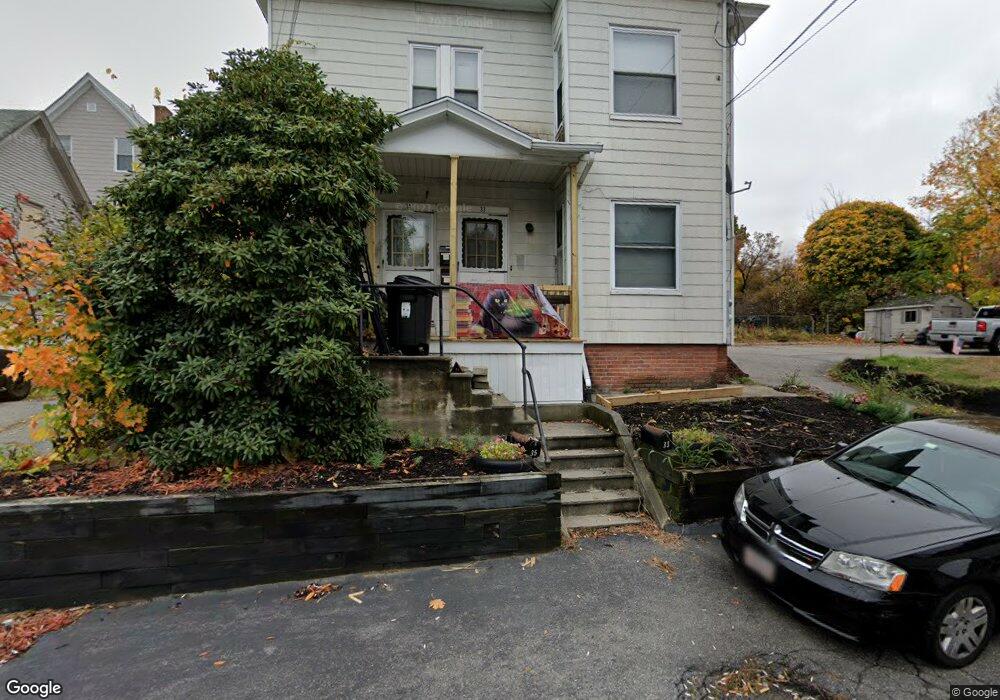
33 West St Clinton, MA 01510
Estimated Value: $446,537 - $590,000
6
Beds
2
Baths
2,580
Sq Ft
$202/Sq Ft
Est. Value
About This Home
This home is located at 33 West St, Clinton, MA 01510 and is currently estimated at $520,884, approximately $201 per square foot. 33 West St is a home located in Worcester County with nearby schools including Clinton Elementary School, Clinton Senior High School, and Clinton Middle School.
Ownership History
Date
Name
Owned For
Owner Type
Purchase Details
Closed on
Oct 29, 2021
Sold by
Prentice-Serrano Ann M
Bought by
Prentice-Serrano Ann M and Serrano Gadiel O
Current Estimated Value
Purchase Details
Closed on
Jul 20, 2007
Sold by
Laferriere Denise R
Bought by
Prentice Ann M
Home Financials for this Owner
Home Financials are based on the most recent Mortgage that was taken out on this home.
Original Mortgage
$208,000
Interest Rate
6.54%
Mortgage Type
Purchase Money Mortgage
Create a Home Valuation Report for This Property
The Home Valuation Report is an in-depth analysis detailing your home's value as well as a comparison with similar homes in the area
Home Values in the Area
Average Home Value in this Area
Purchase History
| Date | Buyer | Sale Price | Title Company |
|---|---|---|---|
| Prentice-Serrano Ann M | -- | None Available | |
| Prentice Ann M | $260,000 | -- |
Source: Public Records
Mortgage History
| Date | Status | Borrower | Loan Amount |
|---|---|---|---|
| Previous Owner | Prentice Ann M | $208,000 |
Source: Public Records
Tax History
| Year | Tax Paid | Tax Assessment Tax Assessment Total Assessment is a certain percentage of the fair market value that is determined by local assessors to be the total taxable value of land and additions on the property. | Land | Improvement |
|---|---|---|---|---|
| 2025 | $5,126 | $385,400 | $105,700 | $279,700 |
| 2024 | $4,784 | $364,100 | $105,700 | $258,400 |
| 2023 | $4,499 | $336,500 | $96,100 | $240,400 |
| 2022 | $4,485 | $300,800 | $87,400 | $213,400 |
| 2021 | $4,240 | $266,000 | $83,200 | $182,800 |
| 2020 | $4,035 | $260,500 | $83,200 | $177,300 |
| 2019 | $3,796 | $238,300 | $80,800 | $157,500 |
| 2018 | $3,632 | $213,900 | $80,800 | $133,100 |
| 2017 | $3,509 | $198,600 | $80,800 | $117,800 |
| 2016 | $3,430 | $198,600 | $80,800 | $117,800 |
| 2015 | $3,027 | $181,700 | $78,400 | $103,300 |
| 2014 | $2,934 | $181,700 | $78,400 | $103,300 |
Source: Public Records
Map
Nearby Homes
- 25 Pearl St
- 57 Clark St
- 719 Main St
- 459 High St
- 30 Henry St Unit 30B
- 23 Ash St
- 55 Sterling St Unit 306
- 55 Sterling St Unit 312
- 55 Sterling St Unit 314
- 55 Sterling St Unit 212
- 508 High St
- 93 Forest St
- 861 Main St
- 155 Cedar St
- 115117 Mechanic St Unit 4
- 115117 Mechanic St Unit 3
- 229 Sterling St
- 101 Woodruff Rd
- 5 Catherine St
- 355 Main St
- 366 High St
- 370 High St
- 370 High St Unit 3
- 370 High St Unit 1
- 370 High St Unit 2
- 376 High St
- 38 West St
- 38 West St Unit 2
- 38 West St Unit U-Garage
- 38 West St Unit 1
- 360 High St
- 360 High St Unit 1-3
- 360 High St Unit C
- 360 High St Unit A
- 49 West St
- 30 West St
- 382 High St
- 46 West St Unit 46
- 44 West St Unit 46
- 55 West St
Your Personal Tour Guide
Ask me questions while you tour the home.